
- Solve real problems with our hands-on interface
- Progress from basic puts and calls to advanced strategies
Interactive Options Course

Posted August 18, 2026 at 1:10 pm
The global bond selloff intensified this morning as the US 30-year yield hit its highest level in 19 years. Investors were avoiding duration prior to the opening bell in consideration of a long list of headwinds, including unbalanced fiscal budgets, substantial issuance from governments to plug revenue gaps, heavy financing needs for the ongoing AI buildout, elevated energy costs, strong growth prospects and uncertain inflation expectations resulting from geopolitical conflicts. President Trump offered an additional challenge to fixed-income markets when he said Washington currently isn’t negotiating or scheduling talks with Tehran, sparking anxiety among market participants that the conflict can drag on for months and continue to disrupt crude flows. But weak domestic economic data came to the rescue before Wall Street’s official open, as lighter-than-anticipated construction, pending home sales, industrial production and import/export prices alongside sluggish hiring drove bids for the long-end. Stocks are getting crushed, however, which is also helping rates sink as credit assets benefit from safe-haven, derisking and rotation buying. Semis, tech and the Mag7 are leading the charge south as all 4 major benchmarks retreat although 7 of the 11 principal sectors are in the green with defensives especially outperforming. Elsewhere, the commodity complex is broadly lower, cryptocurrencies are climbing, the greenback is nearly flat, volatility protection instruments are seeing heavier premiums on greater hedging demand and prediction markets are experiencing engagement.
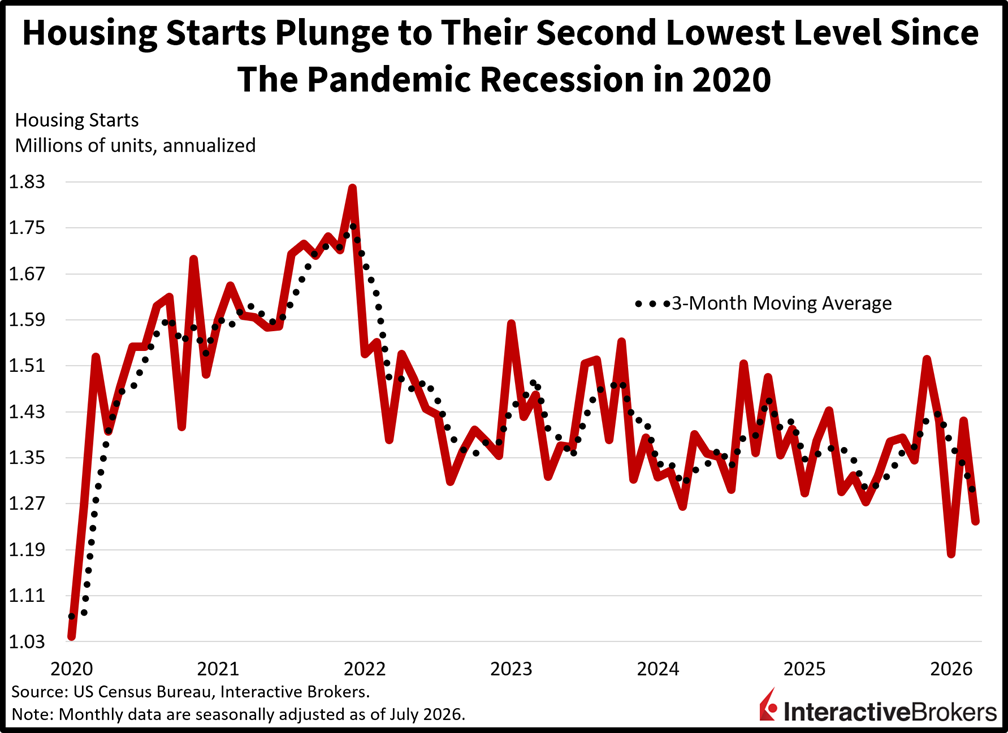
Housing starts retreated in July to the second lowest level since the pandemic era, as elevated mortgage rates and lofty valuations weighed on affordability and builders’ appetites to add supply as a result. Indeed, the 1.239 million seasonally adjusted annualized units (SAAU) was the softest since May 2020 when excluding May 2026’s 1.182 million SAAU. The headline figure additionally missed the median estimate of 1.35 million and fell 12.4% month over month (m/m) from June’s pace of 1.427 million. Almost all asset classes and regions contributed to the weakness, with the multi-unit, single-family, Midwest, West and South segments seeing m/m declines of 15.6%, 9.9%, 27.6%, 13.8% and 12.6%. The Northeast bucked the trend, though, growing 17.1% m/m during the period.
Permit data provided by the same New Residential Construction report were a different story, however, as they expanded 5% m/m to 1.443 million SAAU in July. The headline exceeded the median estimate for 1.37 million and June’s 1.374 million. There was broad growth across asset classes and regions too, with the multi-unit, single-family, Midwest, South and West segments expanding 9.1%, 2.5%, 12.3%, 6.6% and 0.3% m/m. The Northeast was the sole decliner, dropping 2.6%.
Pending home sales collapsed in July as sky-level mortgage rates and all-time high valuations weighed on the capacity for prospective buyers to make offers. The headline result contracted 2.3% m/m, worse than the 0.3% growth expected but a shallower drop than June’s 4.8% plunge. Every region contributed to the weakness with the West, South, Northeast and Midwest experiencing m/m decreases of 4.7%, 2.2%, 2% and 0.7%. Contract signings serve as a leading indicator to closed transactions as they usually occur about a month before keys are exchanged while financing, paperwork and inspections are being finalized.
Import and export prices unexpectedly sank last month, falling 0.4% and 1.3% m/m despite projections calling for 0.1% and 0.2% climbs. The results compare to June’s 0.3% and 0.7% declines. Driving the deflation were fuel imports and non-agricultural exports becoming 7.2% and 1.5% cheaper m/m. Conversely, nonfuel imports and agricultural exports became 0.4% and 1% more costly m/m.
Private-sector hiring accelerated for the first time in eight weeks but remained relatively subdued. This morning’s ADP report reflected 9.5k average jobs added in each of the four weeks leading to Aug. 1, above the 8.25k from the prior print. The headline figure signals monthly roster gains of around 40k, which is particularly sluggish and continues to warrant attention in light of the potential for contracting payrolls to become increasingly common in future reports.
Weak seasonals are hurting markets for the second consecutive session as investors adopt a glass half-empty perspective against the backdrop of heightening geopolitical tensions and uncertain US midterm election prospects. Meanwhile, no one believes that any government in the developed world has what it takes to put its fiscal house in check, and that’s leading to an overall avoidance of long-term sovereign debt; however, there’s a limit to how high bond vigilantes can send term premiums prior to the downside pressure of nosebleed yields curbing growth and inflation. We’re already approaching that point as shown by soft economic data that is poised to plunge rates once slowdown risk gets increasingly considered across the curve. The cycle can’t sustain itself with coupons above 5% for a prolonged period, and that will bring the 20- and 30-year maturities back to a 4-handle by Christmas, in my view.
The number of employed individuals in the UK was virtually unchanged throughout July with payrolls losing 13K individuals, or roughly a 0.0% change, according to an early estimate from the Office for National Statistics. Nevertheless, the total number of workers was down by 94k, or 0.3%, year over year (y/y). During the April through June period, payrolls contracted by 37k quarter over quarter (q/q), or 0.1%, and by 86,000 y/y, or 0.3%.
Earnings ex-bonus in the UK were up 3.5% y/y in June, surpassing the economist consensus estimate for a repeat of May’s 3.4% print. Paycheck growth moderated slightly when including bonuses. After ascending by 4.4% in May, the metric was up only 4.1% in June, which nevertheless surpassed the economist consensus estimate of 4%. Recent gains, furthermore, have been marginally sufficient to increase consumers’ spending clout. For the April to June period, annual real growth based on the Consumer Price Index including owner occupiers’ housing costs was 0.5% for regular pay and 1.1% when including bonuses.
The number of individuals receiving unemployment benefits sank by 11k during July, representing 0.7% m/m and 0.2% y/y declines, according to an early estimate. The decline was steeper than June’s 6.4k drop. Economists anticipated a 16.5k increase. In a related matter, the June unemployment rate was unchanged from 4.9% in the preceding month, but it was a tad higher than the economist consensus estimate of 4.8%.
Labor productivity in the UK based on hours worked unexpectedly strengthened during the second quarter, growing 0.5% y/y, which blew past estimates for a 0.5% decline, according to a flash estimate. When evaluating results on a per-worker-basis, productivity was up 0.7%.
Canadian builders broke ground on new projects at a 229.1k monthly SAAR in July, a decline from the 240.8k starts in June and lower than the economist consensus estimate for 249K, according to the Canada Mortgage and Housing Corporation. While the six-month moving average of 247,377 units was unchanged, the year-to-date total was down 4% y/y.
The Westpac–Melbourne Institute Consumer Sentiment Index was up 6% to 88.9 in August but is still in pessimistic territory and considerably below the year-ago level. The improvement resulted primarily from people with mortgages breathing a sigh of relief after the Reserve Bank of Australia decided to hold its key interest rate. That gain was partially countered by survey respondents believing that unemployment will rise and house prices will fall.
New to Interactive Brokers?
Open AccountInformation posted on IBKR Campus that is provided by third-parties does NOT constitute a recommendation that you should contract for the services of that third party. Third-party participants who contribute to IBKR Campus are independent of Interactive Brokers and Interactive Brokers does not make any representations or warranties concerning the services offered, their past or future performance, or the accuracy of the information provided by the third party. Past performance is no guarantee of future results.
This material is from IBKR Macroeconomics, an affiliate of Interactive Brokers LLC, and is being posted with its permission. The views expressed in this material are solely those of the author and/or IBKR Macroeconomics and Interactive Brokers is not endorsing or recommending any investment or trading discussed in the material. This material is not and should not be construed as an offer to buy or sell any security. It should not be construed as research or investment advice or a recommendation to buy, sell or hold any security or commodity. This material does not and is not intended to take into account the particular financial conditions, investment objectives or requirements of individual customers. Before acting on this material, you should consider whether it is suitable for your particular circumstances and, as necessary, seek professional advice.
Related Articles

















Join The Conversation
For specific platform feedback and suggestions, please submit it directly to our team using these instructions.
If you have an account-specific question or concern, please reach out to Client Services.
We encourage you to look through our FAQs before posting. Your question may already be covered!