
- Solve real problems with our hands-on interface
- Progress from basic puts and calls to advanced strategies
Interactive Options Course
Posted July 1, 2026 at 5:43 am
Investopedia is partnering with All Star Charts on this newsletter. The contents of this newsletter are for informational and educational purposes only.
Alphabet got crushed for six weeks, then landed somewhere that matters.
The stock fell in six of the last seven weeks, its worst stretch since early 2022, right after briefly passing Nvidia in May as the most valuable company on the planet.
That kind of drop usually has investors asking whether the run is over. The chart says something more useful. The pullback has dropped Alphabet onto the exact shelf where a healthy uptrend is supposed to catch itself.
First, why it fell, because the reason matters less than where it stopped.
The selloff was about cash. Alphabet is spending up to $190 billion this year to build out artificial intelligence, and its free cash flow, the money left after the bills, fell 47% in a single quarter.
The finance chief then told analysts that spending climbs again in 2027, with no year named for when it eases, and investors who owned a cash machine started repricing a heavy-spending growth story instead.
The headlines piled on. Two of Google’s top AI researchers left for OpenAI and Anthropic in the same week, the rivals Alphabet is spending billions to beat. None of that is small, but none of it has broken the trend.
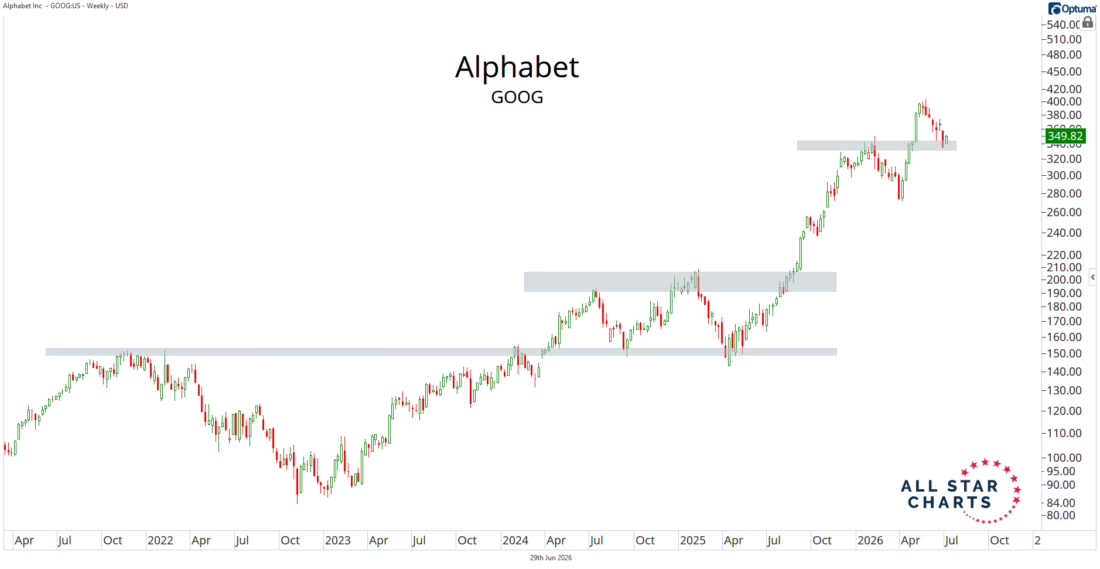
That is the part the noise hides, so zoom out to the weekly chart. Alphabet has been in a clear uptrend for more than a year, a steady climb of higher highs and higher lows. The recent drop did not crack that structure.
It carried price straight back down to the highs from earlier this year, the level the stock spent months pushing through on the way up.
That level is doing real work now, through a principle chart readers call polarity.
When price breaks above an old ceiling and later falls back to it, that ceiling tends to flip into a floor, because the buyers who missed the breakout treat the retest as their second chance. Alphabet is sitting on that floor today.
This is what a logical higher low looks like while it is forming. The trend is intact, the pullback is textbook, and price has returned to support rather than slicing through it. The weight of the evidence says this is the spot where the uptrend reloads, not where it ends.
The thesis has a clear line in the sand.
A weekly close back below those former highs would say the retest failed and the sellers have taken control, and that is the level to respect if it breaks. Above it, the burden stays on the bears.
For all the noise about spending and defections, Alphabet is a leading stock pulling back into support inside a trend that still works.
That is the setup worth owning, and the prior highs are the line that tells you the call is still good.
If you’d like to learn more about what we’re watching, you can check out our analysis on The Morning Show.
—
Originally posted 30th June 2026
Investopedia.com: The comments, opinions and analyses expressed herein are for informational purposes only and should not be considered individual investment advice or recommendations to invest in any security or to adopt any investment strategy. While we believe the information provided herein is reliable, we do not warrant its accuracy or completeness. The views and strategies described on our content may not be suitable for all investors. Because market and economic conditions are subject to rapid change, all comments, opinions and analyses contained within our content are rendered as of the date of the posting and may change without notice. The material is not intended as a complete analysis of every material fact regarding any country, region, market, industry, investment or strategy. This information is intended for US residents only.
Information posted on IBKR Campus that is provided by third-parties does NOT constitute a recommendation that you should contract for the services of that third party. Third-party participants who contribute to IBKR Campus are independent of Interactive Brokers and Interactive Brokers does not make any representations or warranties concerning the services offered, their past or future performance, or the accuracy of the information provided by the third party. Past performance is no guarantee of future results.
This material is from Investopedia and is being posted with its permission. The views expressed in this material are solely those of the author and/or Investopedia and Interactive Brokers is not endorsing or recommending any investment or trading discussed in the material. This material is not and should not be construed as an offer to buy or sell any security. It should not be construed as research or investment advice or a recommendation to buy, sell or hold any security or commodity. This material does not and is not intended to take into account the particular financial conditions, investment objectives or requirements of individual customers. Before acting on this material, you should consider whether it is suitable for your particular circumstances and, as necessary, seek professional advice.
Related Articles













Join The Conversation
For specific platform feedback and suggestions, please submit it directly to our team using these instructions.
If you have an account-specific question or concern, please reach out to Client Services.
We encourage you to look through our FAQs before posting. Your question may already be covered!