
- Solve real problems with our hands-on interface
- Progress from basic puts and calls to advanced strategies
Interactive Options Course

Posted February 10, 2026 at 9:47 am
From SIA Charts
1/ General Motors Company (GM)
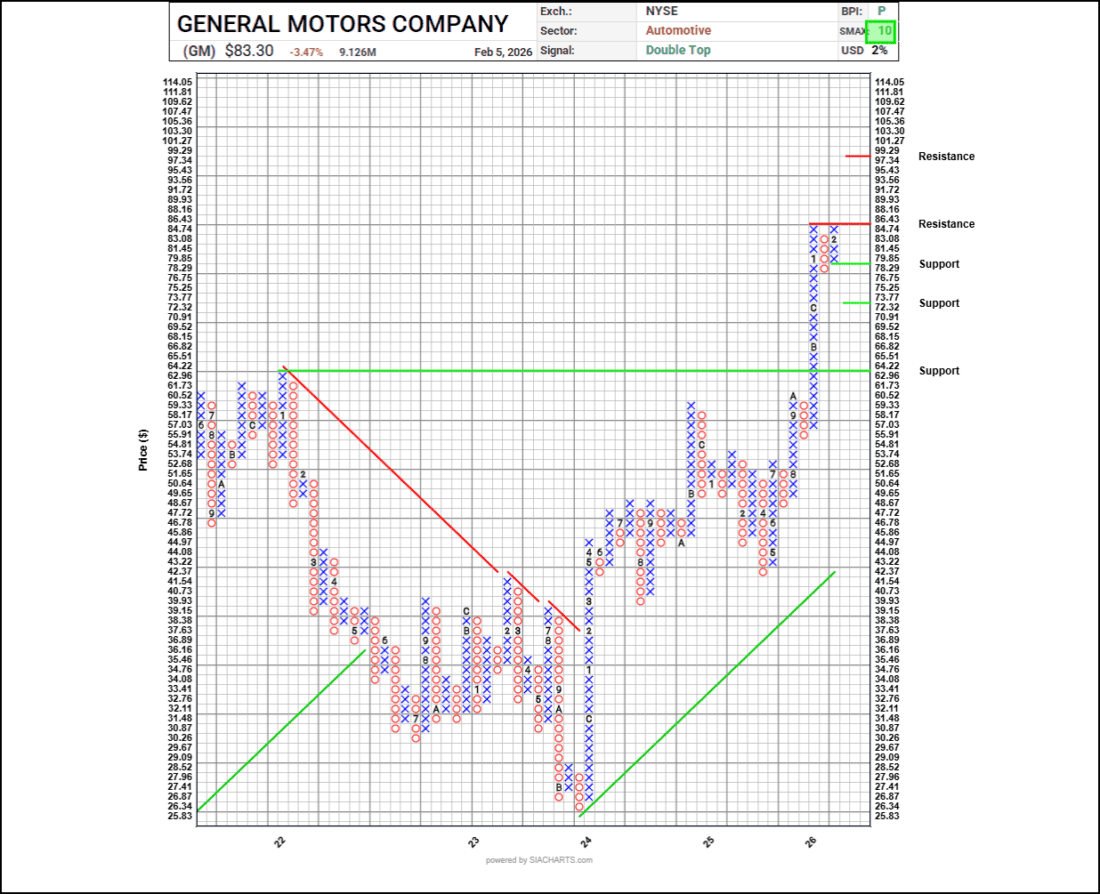
2/ Point and Figure Chart
Investopedia is partnering with CMT Association on this newsletter. The contents of this newsletter are for informational and educational purposes only, however, and do not constitute investing advice. The guest authors, which may sell research to investors, and may trade or hold positions in securities mentioned herein do not represent the views of CMT Association or Investopedia. Please consult a financial advisor for investment recommendations and services.
General Motors Company (GM)
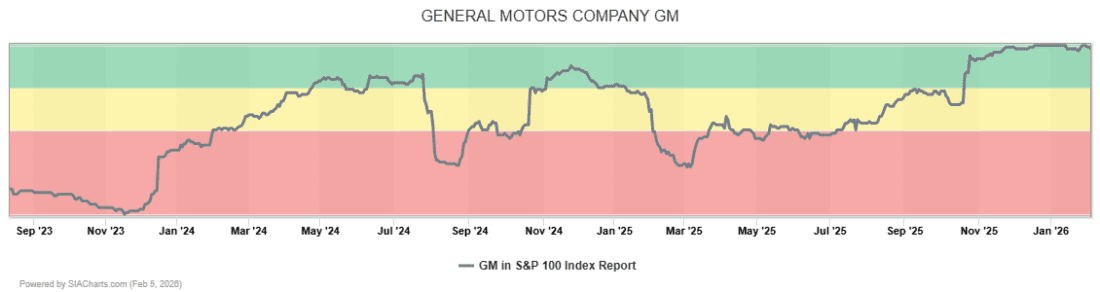
General Motors Company continues to hold a prominent position within the S&P 100 Index Report, currently ranked 4 out of 103, placing it near the top of the index despite modest short-term consolidation. The stock has slipped two spots over the past week, a move that comes as the broader Automotive sector remains in an unfavoured position.
General Motors carries an SIA SMAX Score of 10 out of 10, reflecting strong alignment across SIA technical and relative strength measures. The company sits within the Automotive sector, which ranks 17 out of 31 sectors in the SIA Sector Report and remains in the unfavoured zone, although it has moved up four positions over the past quarter. This combination highlights a stock maintaining strong internal characteristics while operating against a less supportive sector backdrop.
Point and Figure Chart
From a technical standpoint, 3-box reversal support is identified at $78.29, with additional support at $72.32, corresponding to a halfway retracement level, and further support near $62.96. On the upside, resistance is identified at $86.43, followed by higher resistance at $99.29. The most recent point and figure signal is a Double Top, which may suggest continued participation if prevailing conditions remain intact.
Performance metrics show monthly, quarterly, and yearly returns of 0.18%, 21.37%, and 76.04%, respectively. By comparison, the S&P 100 Index recorded 0.89% monthly, 4.63% quarterly, and 16.31% yearly returns, underscoring General Motors’ relative strength over intermediate and longer-term periods despite recent consolidation.
General Motors Company is a global automotive manufacturer engaged in the design, production, and sale of vehicles and vehicle components across multiple brands and markets. Its operations span internal combustion, electric, and autonomous vehicle platforms, with performance influenced by vehicle demand trends, manufacturing costs, and broader conditions within the global automotive industry.
—
Originally posted 09th January 2026
Investopedia.com: The comments, opinions and analyses expressed herein are for informational purposes only and should not be considered individual investment advice or recommendations to invest in any security or to adopt any investment strategy. While we believe the information provided herein is reliable, we do not warrant its accuracy or completeness. The views and strategies described on our content may not be suitable for all investors. Because market and economic conditions are subject to rapid change, all comments, opinions and analyses contained within our content are rendered as of the date of the posting and may change without notice. The material is not intended as a complete analysis of every material fact regarding any country, region, market, industry, investment or strategy. This information is intended for US residents only.
Information posted on IBKR Campus that is provided by third-parties does NOT constitute a recommendation that you should contract for the services of that third party. Third-party participants who contribute to IBKR Campus are independent of Interactive Brokers and Interactive Brokers does not make any representations or warranties concerning the services offered, their past or future performance, or the accuracy of the information provided by the third party. Past performance is no guarantee of future results.
This material is from Investopedia and is being posted with its permission. The views expressed in this material are solely those of the author and/or Investopedia and Interactive Brokers is not endorsing or recommending any investment or trading discussed in the material. This material is not and should not be construed as an offer to buy or sell any security. It should not be construed as research or investment advice or a recommendation to buy, sell or hold any security or commodity. This material does not and is not intended to take into account the particular financial conditions, investment objectives or requirements of individual customers. Before acting on this material, you should consider whether it is suitable for your particular circumstances and, as necessary, seek professional advice.
Related Articles


Join The Conversation
For specific platform feedback and suggestions, please submit it directly to our team using these instructions.
If you have an account-specific question or concern, please reach out to Client Services.
We encourage you to look through our FAQs before posting. Your question may already be covered!