
- Solve real problems with our hands-on interface
- Progress from basic puts and calls to advanced strategies
Interactive Options Course
Posted December 3, 2025 at 4:35 am
From SIA Charts
1/ Saputo Inc. (SAP.TO)
2/ Candlestick Chart
3/ Point and Figure Chart
Investopedia is partnering with CMT Association on this newsletter. The contents of this newsletter are for informational and educational purposes only, however, and do not constitute investing advice. The guest authors, which may sell research to investors, and may trade or hold positions in securities mentioned herein do not represent the views of CMT Association or Investopedia. Please consult a financial advisor for investment recommendations and services.
Saputo Inc. (SAP.TO)
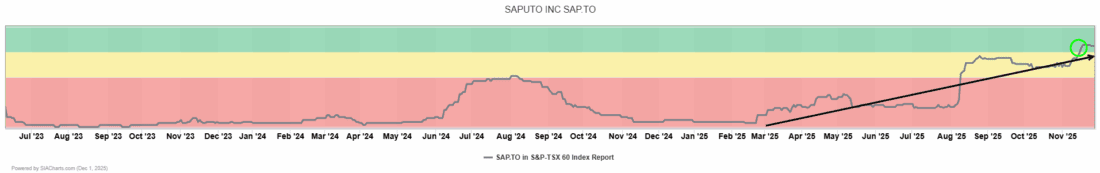
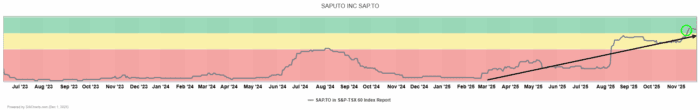
In today’s edition of the Daily Stock Report, we take a look at Saputo Inc (SAP.TO), a global dairy processing consumer staples company. Saputo resides in the favoured zone of many of the SIA reports it is a component of, particularly the various consumer staples reports found on the SIA Platform. Recently, SAP.TO moved into the favoured zone of the SIA S&P/TSX 60 index report. This move continues an upward trend which started in August when it moved out of the red unfavoured zone where it sat for more than 2 years. With the market volatility over the past month or so, this may indicate rotation into defensive sectors as a safe haven. As of Friday’s close, Saputo sits in the favoured zone in the 13th spot, up 10 spots from last month, and 7 spots in the last quarter. This highlights the strength of SIA Charts’ relative strength rankings in assisting investors with identifying stocks and sectors that are outperforming their peers or index benchmarks. Outperformance typically indicates positive investor expectations for a company or sector.
Candlestick Chart
Looking at the long term 15 year monthly candlestick chart, a major breakout appears to be underway in Saputo (SAP.TO) shares. After an initial runup from 2010 to early 2017, when the shares trended in a steady uptrend from $10 to a high of $40, the shares then exhibited a declining series of highs and lows which is visible over the past 8 years. Shares declined from $40 to $22, where they ultimately bottomed earlier this year, which was also the low in 2022, making them poor investments even for long-term buy-and-hold advisors. Since bottoming out in January, the shares reversed, ultimately breaking above the declining wedge pattern once they moved above the $33 level. The last November monthly candlestick has been extremely bullish as the shares closed the month near the month’s high. Another inflection point is approaching as the shares challenge the long term high at the $42 level. This is the next resistance level. If the shares continue to maintain strength and move through $42, the next resistance above this level will be at the $50 round number. The price action ahead will determine whether the shares stall at this long term resistance level or if the uptrend continues.

Point and Figure Chart
When analysing the point and figure chart at a 2% scale to identify more precise support and resistance levels, the pattern shows a predominantly wide, sideways, trendless formation with a classic double bottom at the $22.00 level, visible in both the 2022 and Jan 2025 time frames. Since the beginning of the year, the shares have been in a strong rising column of X’s lasting 25 boxes without a 3-box reversal in place. Saputo is quickly approaching its long term resistance level at $40.63, a level it bumped its head at three times in October 2016, February 2017, and November 2017. This is an important level to monitor as it may represent formidable resistance. With a SMAX of 9 out of 10, the shares are showing good near term strength against the asset classes. With such a large move year to date, if the shares pause to digest the gain, support will be found at the 3-box reversal of $36.08. Next support, should the shares fail at the 3 box reversal point, can be found at $34.00. If the shares can maintain strength and break above the forthcoming resistance at $40.63, the next resistance will be at $48.56 based on a measured move. At present, the shares are exhibiting a positive Spread Triple Top pattern.
Saputo is a global dairy processor domiciled in Canada (28% of fiscal 2022 sales) with operations in the United States (43%), the U.K. (6%), and other international markets (23%). It sells cheese, cream, fluid milk, and other dairy products. In the retail segment (50% of revenue), its mix of brands includes Saputo, Armstrong, Cheer, Cathedral City, and Frylight. Saputo also competes in food service (30% of revenue) and industrials (20% of revenue), which houses its ingredients business.

—
Originally posted 1st December 2025
Investopedia.com: The comments, opinions and analyses expressed herein are for informational purposes only and should not be considered individual investment advice or recommendations to invest in any security or to adopt any investment strategy. While we believe the information provided herein is reliable, we do not warrant its accuracy or completeness. The views and strategies described on our content may not be suitable for all investors. Because market and economic conditions are subject to rapid change, all comments, opinions and analyses contained within our content are rendered as of the date of the posting and may change without notice. The material is not intended as a complete analysis of every material fact regarding any country, region, market, industry, investment or strategy. This information is intended for US residents only.
Information posted on IBKR Campus that is provided by third-parties does NOT constitute a recommendation that you should contract for the services of that third party. Third-party participants who contribute to IBKR Campus are independent of Interactive Brokers and Interactive Brokers does not make any representations or warranties concerning the services offered, their past or future performance, or the accuracy of the information provided by the third party. Past performance is no guarantee of future results.
This material is from Investopedia and is being posted with its permission. The views expressed in this material are solely those of the author and/or Investopedia and Interactive Brokers is not endorsing or recommending any investment or trading discussed in the material. This material is not and should not be construed as an offer to buy or sell any security. It should not be construed as research or investment advice or a recommendation to buy, sell or hold any security or commodity. This material does not and is not intended to take into account the particular financial conditions, investment objectives or requirements of individual customers. Before acting on this material, you should consider whether it is suitable for your particular circumstances and, as necessary, seek professional advice.
Related Articles


Join The Conversation
For specific platform feedback and suggestions, please submit it directly to our team using these instructions.
If you have an account-specific question or concern, please reach out to Client Services.
We encourage you to look through our FAQs before posting. Your question may already be covered!