
- Solve real problems with our hands-on interface
- Progress from basic puts and calls to advanced strategies
Interactive Options Course

Posted October 28, 2025 at 10:42 am
By Todd Stankiewicz CMT, CFP, ChFC
1/ URA’s Rally Stalls
2/ Healthcare’s Hidden Rotation
3/ Healthcare (XLV) – Patience Required
Investopedia is partnering with CMT Association on this newsletter. The contents of this newsletter are for informational and educational purposes only, however, and do not constitute investing advice. The guest authors, which may sell research to investors, and may trade or hold positions in securities mentioned herein do not represent the views of CMT Association or Investopedia. Please consult a financial advisor for investment recommendations and services.
URA’s Rally Stalls
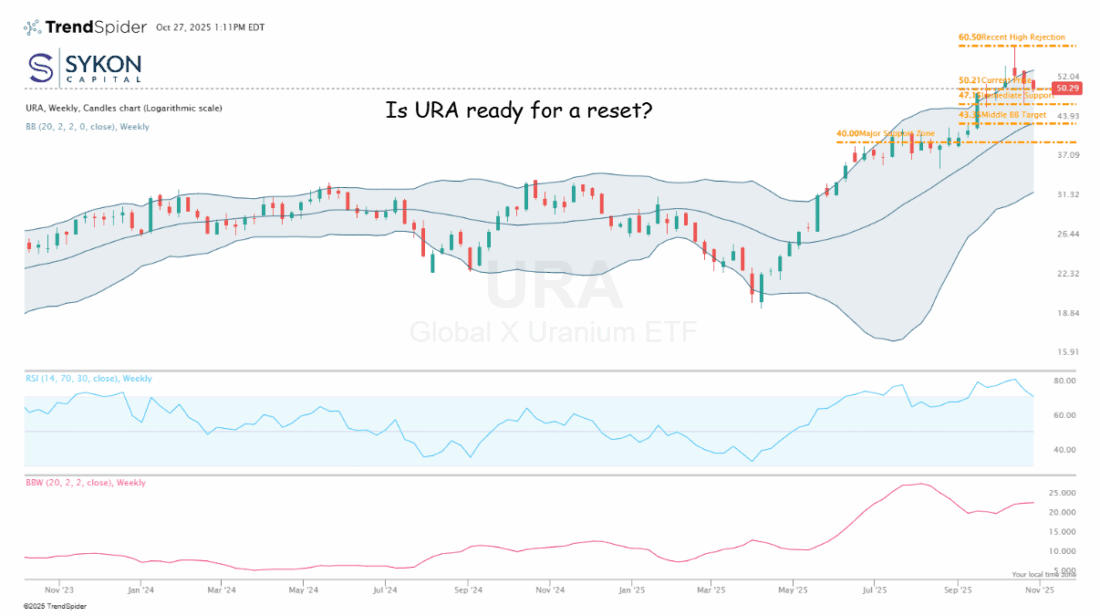
The Global X Uranium ETF (URA) is flashing warning signs after a remarkable run throughout 2025, with technical indicators suggesting a potential pullback to key support levels.
URA trades at $50.21, down 17% from its October 13th high of $60.50. The weekly chart reveals classic signs of exhaustion that demand attention from technical traders.
Critical Technical Levels to Watch:
The RSI sits at 71, still elevated after touching 80+ during the peak. This means selling pressure hasn’t exhausted itself, there’s plenty of room to fall toward 50 or lower. Price recently broke below the upper Bollinger Band after rejection, triggering a textbook mean reversion setup. The bands are now compressing after extreme expansion, with price gravitating toward that middle band at $43.35.
Watch $47.15 closely. Hold this level and URA could bounce back toward $52. Break below it, and the probability jumps to 60-70% that we test the $43.35 middle Bollinger Band target. The technical setup strongly favors continued weakness until conditions reset.
URA isn’t alone. The entire commodity complex is under pressure – gold down 8.8%, broad commodities weakening – while the S&P 500 makes new highs. This risk-on rotation out of commodities creates significant headwinds for uranium.
Bottom Line: For traders holding URA after this extended run, position sizing and stop-loss discipline are paramount. With RSI still elevated, Bollinger Bands compressing, and $47.15 as the critical support, the path of least resistance appears lower until technical conditions reset.
Healthcare’s Hidden Rotation
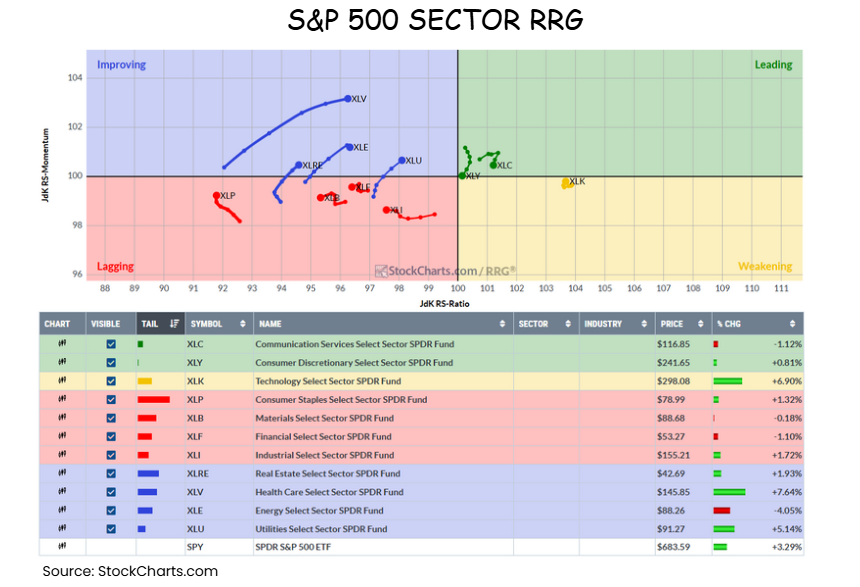
Relative Rotation Graphs (RRG) continue to serve as a powerful visualization tool for identifying potential sector leadership changes, and the current weekly RRG of S&P 500 sectors reveals an intriguing rotation underway. While it may be difficult to detect at first glance, traditional market leaders including Consumer Discretionary, Communication Services, and Information Technology appear to be rolling over from their dominant positions.
What makes this rotation particularly noteworthy is the movement of defensive and previously underperforming sectors. Utilities, Healthcare, Real Estate, and Energy are transitioning from the improving quadrant toward leading status. In RRG methodology, sectors typically rotate clockwise through four quadrants – leading, weakening, lagging, and improving – with distance from the center indicating the velocity of that rotation.
Among these emerging leaders, Healthcare (represented by the ETF XLV) stands out as potentially the most compelling opportunity. Healthcare has demonstrated resilience, with the sector posting gains even amid broader market volatility, yet it has been consistently underestimated by investors due to its prolonged period of underperformance relative to growth-oriented sectors.
The sector’s current positioning suggests it may be building momentum at a critical inflection point. Healthcare providers and pharmaceuticals/biotechnology subsectors remain undervalued versus their 11-year averages, presenting a potential value opportunity as the sector rotates into a leadership position. Additionally, the integration of AI-driven solutions in healthcare is creating operational efficiencies and driving innovation, providing fundamental support for the technical rotation signal.
For investors monitoring sector rotation strategies, Healthcare warrants close attention. The combination of improving relative strength, undervaluation, and technological tailwinds could position XLV and related healthcare equities as unexpected leaders in the coming months, a development that many market participants may be overlooking.
The Rare Earth Reckoning
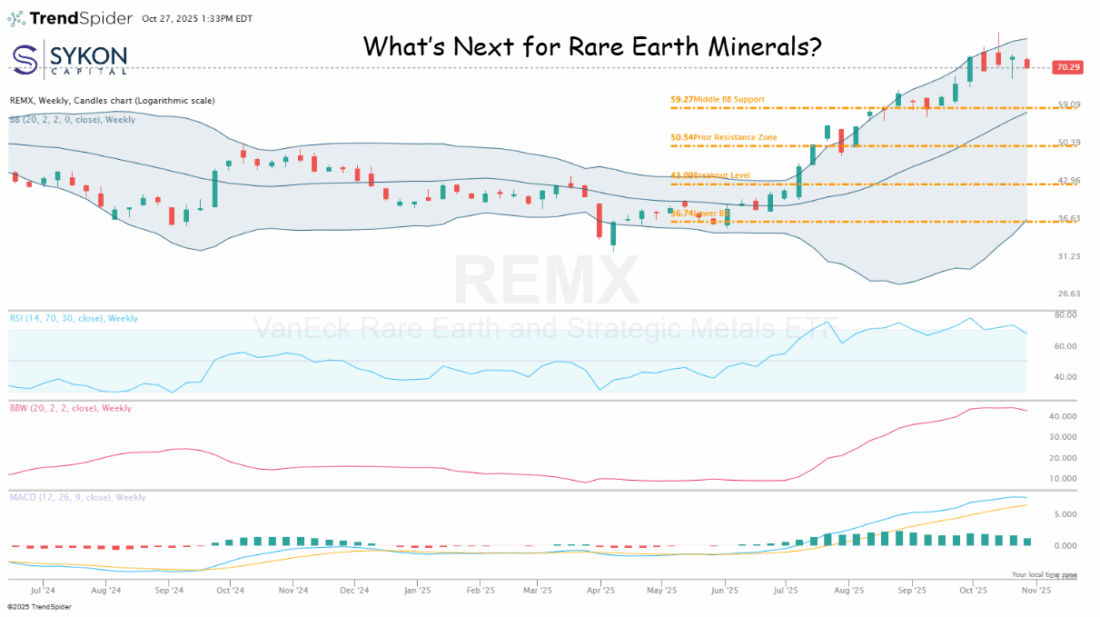
Rare earth minerals have exploded into the spotlight as U.S.-China trade tensions reach a boiling point, but the technical picture for REMX (VanEck Rare Earth and Strategic Metals ETF) is flashing warning signals that traders can’t afford to ignore.
REMX has delivered a stunning +81% surge from May’s $38.95 low to October’s $81.71 peak, fueled by the Trump administration’s $8.5 billion Australia critical minerals partnership signed October 20th and China’s rare earth export restrictions announced earlier this month. But parabolic moves rarely end well.
Currently trading at $70.21, REMX sits in dangerous territory. The RSI has spiked to 75-77, deep into overbought conditions. Bollinger Band Width has exploded to multi-year highs near 40-42, signaling extreme volatility and probable mean reversion ahead.
The primary pullback target? The middle Bollinger Band at $59.27, representing a potential 15% correction. Break that level, and a catastrophic air gap opens down to $36.74, a potential 48% plunge from current levels.
Here’s the critical question every REMX holder must answer: Are you comfortable with your position size if we hit that $36-$59 zone?’
The $43-$50 breakout zone remains the line in the sand for long-term bulls. Hold above it, and the structural story stays intact. Lose it, and the entire rally unravels.
Technical analysis isn’t about predicting profits, it’s about managing risk effectively. With REMX stretched to extremes, position sizing and stop-loss discipline aren’t optional.
—
Originally posted 28th October 2025
Investopedia.com: The comments, opinions and analyses expressed herein are for informational purposes only and should not be considered individual investment advice or recommendations to invest in any security or to adopt any investment strategy. While we believe the information provided herein is reliable, we do not warrant its accuracy or completeness. The views and strategies described on our content may not be suitable for all investors. Because market and economic conditions are subject to rapid change, all comments, opinions and analyses contained within our content are rendered as of the date of the posting and may change without notice. The material is not intended as a complete analysis of every material fact regarding any country, region, market, industry, investment or strategy. This information is intended for US residents only.
Information posted on IBKR Campus that is provided by third-parties does NOT constitute a recommendation that you should contract for the services of that third party. Third-party participants who contribute to IBKR Campus are independent of Interactive Brokers and Interactive Brokers does not make any representations or warranties concerning the services offered, their past or future performance, or the accuracy of the information provided by the third party. Past performance is no guarantee of future results.
This material is from Investopedia and is being posted with its permission. The views expressed in this material are solely those of the author and/or Investopedia and Interactive Brokers is not endorsing or recommending any investment or trading discussed in the material. This material is not and should not be construed as an offer to buy or sell any security. It should not be construed as research or investment advice or a recommendation to buy, sell or hold any security or commodity. This material does not and is not intended to take into account the particular financial conditions, investment objectives or requirements of individual customers. Before acting on this material, you should consider whether it is suitable for your particular circumstances and, as necessary, seek professional advice.
Any discussion or mention of an ETF is not to be construed as recommendation, promotion or solicitation. All investors should review and consider associated investment risks, charges and expenses of the investment company or fund prior to investing. Before acting on this material, you should consider whether it is suitable for your particular circumstances and, as necessary, seek professional advice.
Related Articles


")


Join The Conversation
For specific platform feedback and suggestions, please submit it directly to our team using these instructions.
If you have an account-specific question or concern, please reach out to Client Services.
We encourage you to look through our FAQs before posting. Your question may already be covered!