
- Solve real problems with our hands-on interface
- Progress from basic puts and calls to advanced strategies
Interactive Options Course

Posted October 23, 2025 at 12:15 pm
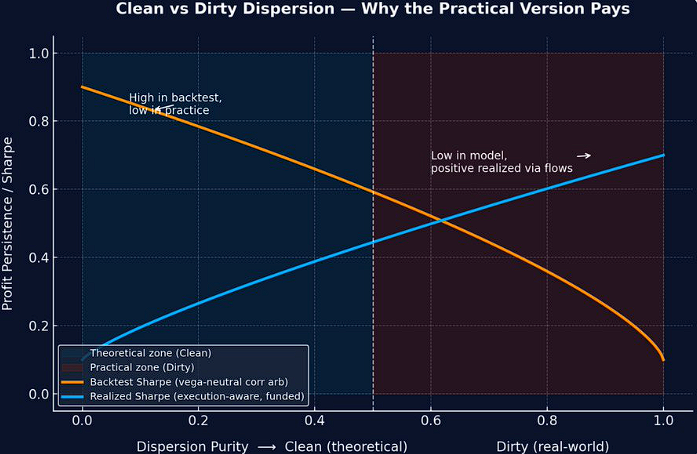
Everyone loves the textbook dispersion trade: short index vol, long single stocks, vega-neutral. But the people who actually make money run the dirty version. Here’s why theory dies in backtests and practice wins in P&L.
Source: Quant Insider
In theory, dispersion trading isolates the correlation risk embedded in index options. The clean (academic) setup can be described as follows:
Formally, for an equal-weighted index of N stocks:
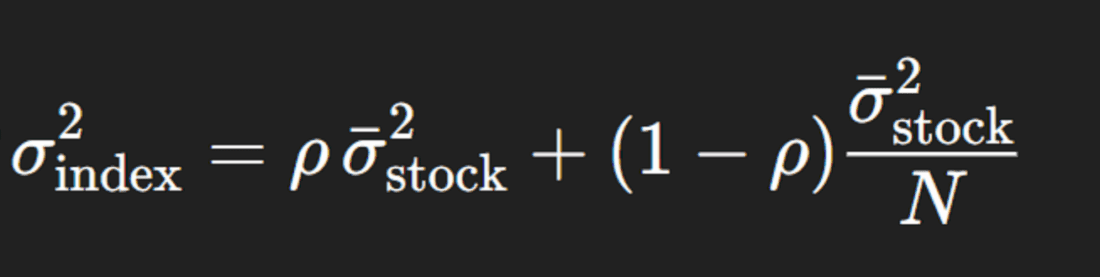
A dispersion trader is effectively short ρ (rho). If realized correlation falls (i.e., stocks move more idiosyncratically), the portfolio’s P&L rises; if correlations spike (i.e., during a systemic move), losses occur.
In this idealized world:
That’s the clean math.
Real dispersion books don’t isolate correlation perfectly because practical constraints dominate:
a. Execution Friction:
You’re not trading one “index” vs. one “basket.” You’re trading 500 single names, each with its own bid-ask, greeks, and volatility skew. The moment you cross those spreads, your edge is gone. The theoretical 1–2 vol point edge in implied correlation can vanish in execution cost.
b. Vega Weighting vs. Gamma Risk:
In practice, traders size on vega notionals (matching exposure per 1 vol point move). But correlation shocks hit through gamma, not vega. So a “vega-neutral” book isn’t truly correlation-neutral during stress — when index gamma explodes.
c. Funding & Margin:
Index short legs free margin, but long single-stock options require collateralized margin. Funding spreads compress your realized edge — dirty dispersion must include carry cost and financing P&L. Market makers and vol-arb funds typically finance these through repo or securities lending desks, adding another layer of slippage.
d. Liquidity Asymmetry:
Index options are deep and liquid — single-stock options aren’t. The skew and term-structure shapes differ widely across names. When we say “dirty,” we are talking about the impossibility of finding true parallel strikes and maturities across hundreds of single names. Each stock has unique idiosyncratic volatility smiles, dividend assumptions, and borrow rates.
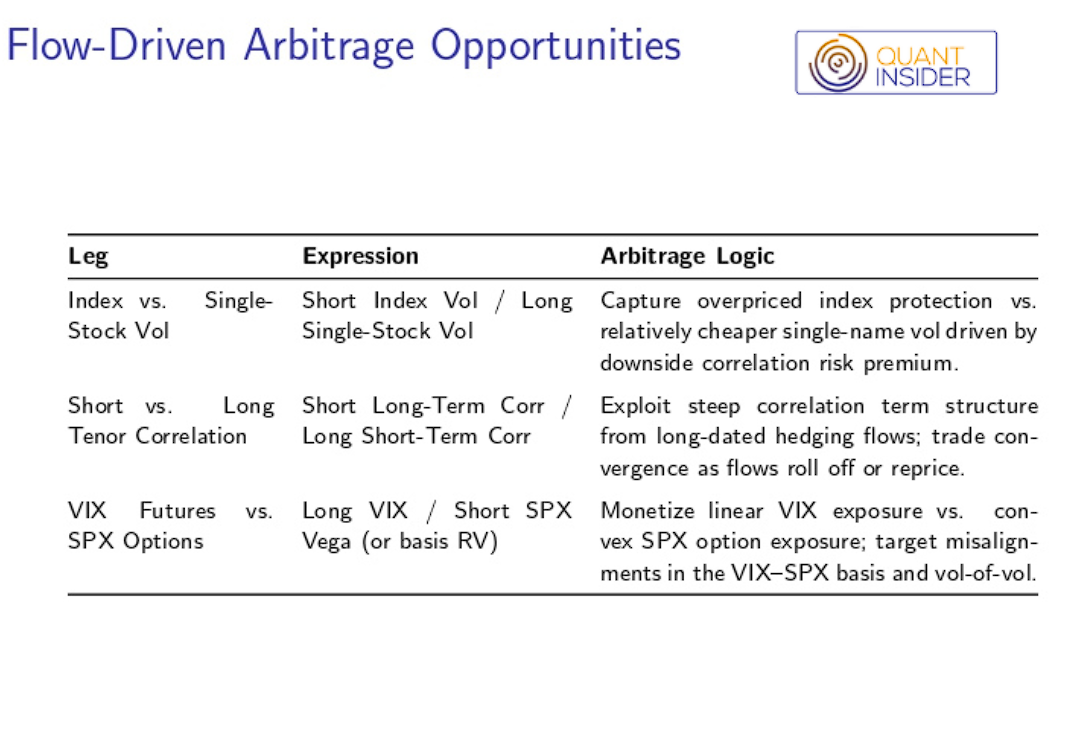
The “dirtness” is not a bug — it’s the trade. Prop firms (e.g., SIG, Citadel, Jane Street, Optiver) run their own versions of dispersion trading:
It’s not as simple as selling SPX volatility and buying the 500 constituent stocks. The real considerations are about market flows and why they exist. That’s where the true alpha lies — the edge isn’t in the math, it’s in flow asymmetry:
Here’s how real P&L attribution typically decomposes:
In clean dispersion, only the first term should exist. In dirty dispersion, the other four dominate your realized outcome.
Index implied vol: 12%
Average single-stock implied vol: 28%
Implied correlation (toy identity under equal vols/weights):

Ex post reality:
What that implies for the index leg: Implied index variance from the identity:

Variance gap captured by a short-index / long-basket stance (directionally):
Execution drag (basket reality): You don’t cross one spread, you cross a basket. Suppose you trade the top 200 names, and your average all-in spread toll works out to 1.5 bps per name (vega-weighted, in P&L terms relative to index notional). Toll ≈ 200 × 1.5 bps = 300 bps — that’s 3% of index-notional P&L equivalent on the round-trip. If your variance edge translates to only a few percent-of-vega across the life, 300 bps can nuke it.
Funding / carry: Long single-name options consume margin; index shorts free less than you think. Add ~50–100 bps/yr funding drag (repo, margin, borrow frictions). On a 3–6M trade horizon, knock off another 15–50 bps.
Surface mismatch (residual vega/gamma): Your “vega-neutral” sizing doesn’t immunize gamma in a stress or skew curvature when names gap differently. Expect mark-to-market noise that can easily rival your theoretical correlation edge unless you rebalance ruthlessly — which costs more spread.
Clean math edge: Correlation drop from 0.184 → 0.12 gives you a 0.0050 vol² variance advantage (12.0% → 9.7% implied-to-realized on the index leg, holding stock vols steady).
Dirty reality: 300 bps basket crossing + carry/funding 15–50 bps + mismatch/gamma noise can fully offset that advantage unless you:
You can’t arbitrage correlation cleanly; you can only exploit flow imbalances when:
The “dirty” in dirty dispersion is the alpha.
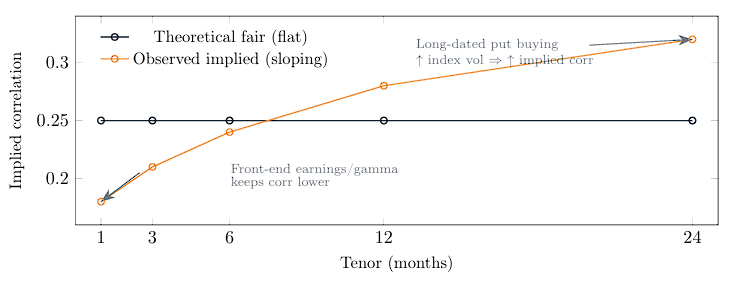
Figure 1: Flows bend the correlation curve. Long-end hedging demand lifts index vol relative to single stocks, raising long-tenor implied correlation.
Source: Quant Insider
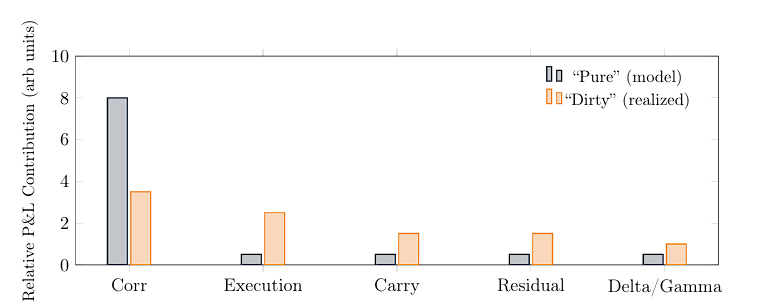
Figure 2: The model says “short correlation earns carry”; the desk says “only if it survives execution, funding, and curvature mis-matches.”
Source: Quant Insider
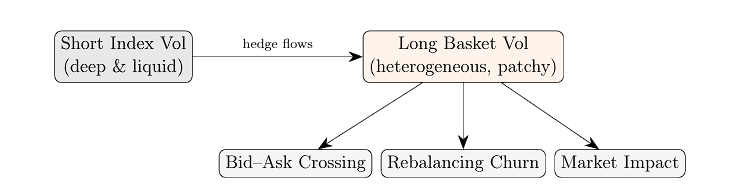
Figure 3: Execution frictions multiply across a large basket: you do not cross one spread, you cross hundreds.
Source: Quant Insider
Other articles by Quant Insider include:
For more in-depth information, visit Quant Insider at this link: https://quantinsider.io/.
Information posted on IBKR Campus that is provided by third-parties does NOT constitute a recommendation that you should contract for the services of that third party. Third-party participants who contribute to IBKR Campus are independent of Interactive Brokers and Interactive Brokers does not make any representations or warranties concerning the services offered, their past or future performance, or the accuracy of the information provided by the third party. Past performance is no guarantee of future results.
This material is from Quant Insider and is being posted with its permission. The views expressed in this material are solely those of the author and/or Quant Insider and Interactive Brokers is not endorsing or recommending any investment or trading discussed in the material. This material is not and should not be construed as an offer to buy or sell any security. It should not be construed as research or investment advice or a recommendation to buy, sell or hold any security or commodity. This material does not and is not intended to take into account the particular financial conditions, investment objectives or requirements of individual customers. Before acting on this material, you should consider whether it is suitable for your particular circumstances and, as necessary, seek professional advice.
Options involve risk and are not suitable for all investors. For information on the uses and risks of options, you can obtain a copy of the Options Clearing Corporation risk disclosure document titled Characteristics and Risks of Standardized Options by going to the following link ibkr.com/occ. Multiple leg strategies, including spreads, will incur multiple transaction costs.


Join The Conversation
For specific platform feedback and suggestions, please submit it directly to our team using these instructions.
If you have an account-specific question or concern, please reach out to Client Services.
We encourage you to look through our FAQs before posting. Your question may already be covered!