
- Solve real problems with our hands-on interface
- Progress from basic puts and calls to advanced strategies
Interactive Options Course
Posted September 17, 2025 at 12:49 pm
Investors are patiently awaiting this afternoon’s Fed decision and markets are mixed heading into the event. While the consensus heavily favors a 25-bp reduction, a jumbo 50 could be delivered if the voices of Governors Waller, Bowman and Miran convince other officials of significant unemployment risks. Conversely, Kansas City Fed President Schmid may opt for a pause and win over some voting members in light of above-target inflation and uncertainty concerning the potential for tariffs to fuel price pressures at a later time. Meanwhile, today’s data releases included the weakest level of construction permits in 63 months alongside tanking housing starts, despite plunging mortgage yields. The lack of groundbreaking activity occurs against the backdrop of elevated inventories, heavy valuations, immigration restrictiveness and borrowing costs that are still weighing on affordability. On Wall Street, equity benchmarks are bifurcated ahead of the meeting, with the Dow Jones Industrial and Russell 2000 indices appreciating while the Nasdaq 100 and S&P 500 gauges retreat. But sectoral breadth is strongly positive with only technology and consumer discretionary descending, which is emblematic of the broader rally we’ll get if the central bank delivers a dovish quarter or half while signaling future cuts in subsequent meetings. Overall, risk-assets, safe-haven holdings and the economy are doing great; however, there are certain cyclically oriented, rate-sensitive pockets that aren’t, like manufacturing, real estate and small businesses. They would benefit greatly from a speedier walk down the monetary policy stairs, helping to reduce stock market concentration. Elsewhere, the greenback, Treasuries and volatility protection instruments are nearly flat, while the commodity complex ex lumber and bitcoins is declining. Forecast contracts are also seeing interest.
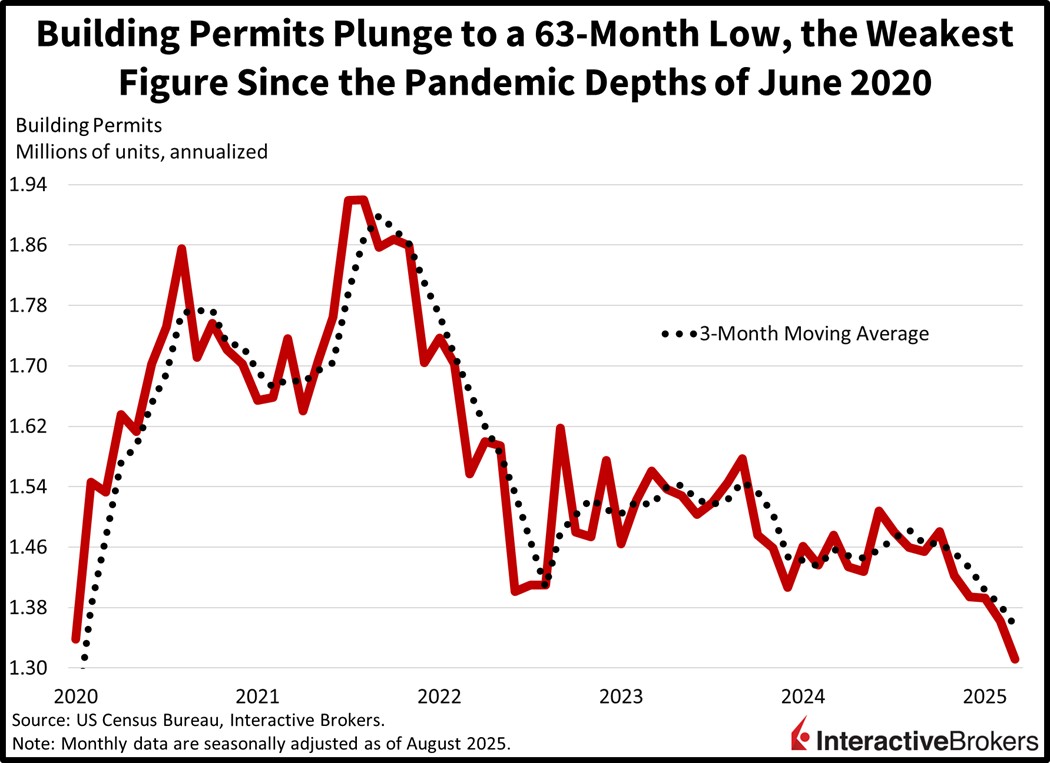
Plunging mortgage rates are failing to contain the precipitous fall in construction permits, which sank to a 63-month low last month, reaching the weakest level since the pandemic depths of June 2020. The 1.312 million seasonally adjusted annualized units (SAAU) missed the 1.37 million expectation and represented a 3.7% month-over-month (m/m) reduction from July’s 1.362 million. It’s the fifth consecutive month of declines. The contraction was driven by a 6.7% m/m decrease in the apartment building category, while single-family fell a more modest 2.2%. From a regional perspective, the Midwest, South and Northeast slipped 9.5%, 6.9% and 3.2%, but the West was as an outlier, rising 9.5%.
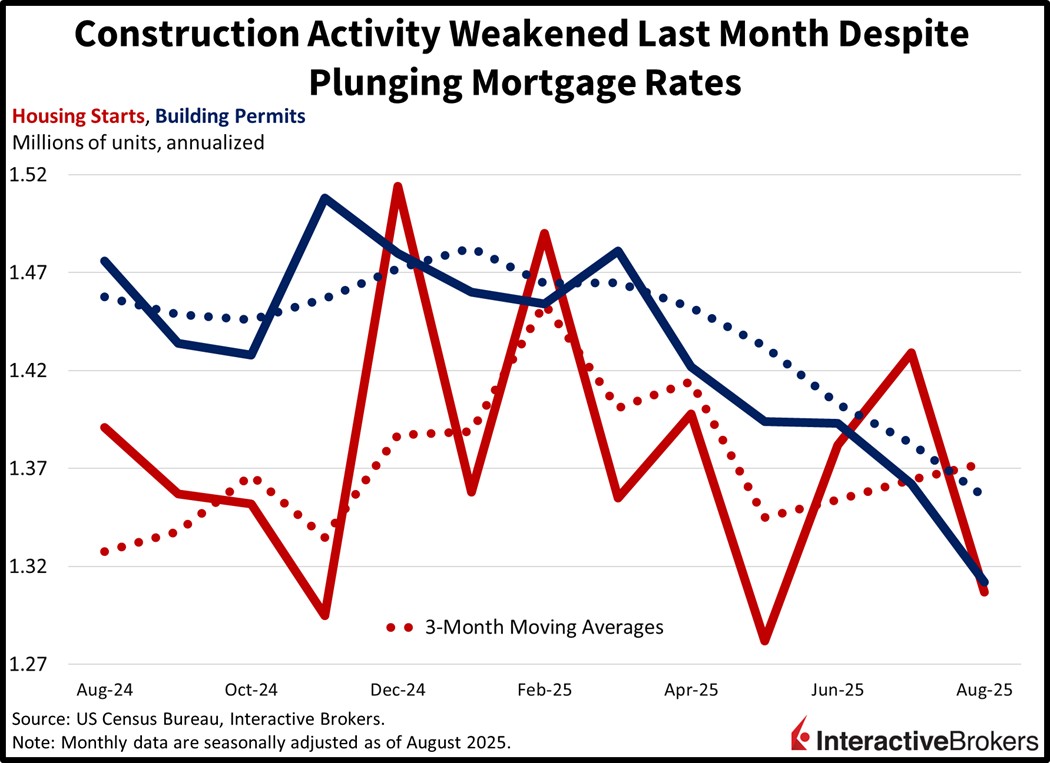
Housing starts, released in the same monthly report, also arrived near the weakest levels since the pandemic. The headline August result declined 8.5% m/m to 1.307 million SAAU, below the expected 1.37 million as well as July’s 1.362 million. Similar to permits, apartment building activity drove the weakness, contracting 11% m/m, but single-family also weakened by 7%. Meanwhile, there was stark regional bifurcation. In the West and Northeast, construction increased 30.4% and 9.2% m/m; however, the Midwest slipped 10.9% and the South, which is the largest geography based on the total number of projects, slumped a sharp 21%, countering strength elsewhere.
The AI-fueled bull market can broaden out to other categories if the Fed prioritizes labor vulnerabilities ahead of inflation risks. The development would quell the nerves of bearish equity market participants who feel that the upside has been too concentrated, excluding segments of the space that essentially requires incrementally accommodative monetary policy to appreciate. But too hawkish of a stance emphasizing the potential of heavier price pressures would likely deliver losses to fixed-income assets and equities alike, effectively tightening financial conditions and disappointing investors that have been enthusiastic about rate cuts. Meanwhile, the meeting has probably been a contentious one, featuring disagreements across the board, with most preferring a quarter, others a half and a few favoring a pause.
Japan increased its exports to Asian neighbors and the European Union last month, but a 13.8% decline in shipments to the United State contributed to the country’s trade deficit more than doubling. In August, purchases of foreign items exceeded shipments to other countries by ¥242.5 billion, up from the ¥118.4 billion July deficit. Nevertheless, the print was considerably smaller than the economist consensus estimate for a ¥513.6 billion negative imbalance.
Exports sank 0.1% year over year (y/y) in August after falling 2.6% in July, marking four consecutive months of declines. The result, however, was better than the economist consensus forecast for the metric to sink 1.9%. Weak purchases of automobiles and steel products were the strongest drivers of the drop in US demand, a result of the Trump Administration slapping a 27.5% import tax on the country’s products. More recently, the US has agreed to lower the rate to 15%, but the change didn’t go into effect until Sept. 16. Additionally, China’s ailing economy trimmed the country’s consumption of Japanese products by 0.5%. Loftier purchases of Japanese products by various Asian nations and the EU partially offset declines in trading volumes with China and the US.
Purchases of foreign products by the archipelago nation also contracted, descending 5.2% y/y, an improvement from the preceding month’s 7.4% southward movement and less severe than the economist consensus estimate for a 4.2% drop.
Inflation in the UK last month eased somewhat but remained considerably hotter than the Bank of England’s 2% target, which is a thorny issue for the central bank that meets tomorrow and is facing a weakening job market. The Consumer Price Index including housing, or the CPIH, climbed 0.3% m/m and 4.1% y/y in August, down slightly from 0.4% and 4.2% in July, according to the Office for National Statistics (ONS). When excluding energy, food, alcohol and tobacco, which have volatile pricing, the core CPIH was up 4% y/y compared to 4.2% in the preceding period. Shelter was a considerable factor, with the owner occupiers’ housing cost (OOH) escalating 5.3%. However, the CPI, which doesn’t include housing, moved from 0.1% m/m in July to 0.3% in August, but the y/y result of 3.8% was unchanged. Both metrics met expectations. In a similar manner, the core CPI increased from 0.2% to 0.3% m/m but eased from 3.8% y/y to 3.6%. The 12-month result was better than the economist consensus estimate of 3.7%.
The sticky inflation comes one day after the ONS reported that 10,000 job vacancies disappeared in August, the 38th consecutive monthly decline that has occurred despite the BoE’s 12-month easing campaign that has brought its key interest rate to 4%. Today’s higher-than-target inflation print combined with ongoing job market weakness is likely to result in a lively Bank of England meeting tomorrow as policymakers will need to debate the merits of shoring up employment opportunities with monetary easing or maintaining enough restrictiveness to prevent a resurgence in price pressures.
The UK’s House Price Index reflected a 2.8% y/y increase in the cost of buying homes in August, a lower print than the 3.6% economist consensus expectation and July’s 3.7% result.
The Bank of Canada cut its overnight rate today from 2.75% to 2.5%, its first easing action since March. In a statement, the central bank said a weaker economy occurring during the trade war with the US, rising unemployment and a disappointing GDP report justified the decision. Price pressures, furthermore, have been fairly stable. During the organization’s prior three meetings, policymakers had decided to hold off on making rate cuts in order to better understand the impact of the country’s trade dispute with the US. The bank statement also emphasized that policymakers are focused on ensuring that Canadians have confidence in price stability during this period of trade uncertainty.
The Australia economy is poised to see a loss of growth momentum through the end of this year, according to the Westpac-Melbourne Institute Leading Index. The six-month annualized growth rate of the benchmark fell to -0.16% in August after hitting a positive 0.11% in July and a recent peak of 0.86% in February. Last month’s score was the first negative reading since September 2024. Consumer unemployment expectations, commodity prices, dwelling approvals and the overall outlook of consumers were the most significant detractors from the index’s score. The yield spread, US industrial production and total hours worked also contributed to the decline but to a smaller extent.
Singapore’s non-oil exports fell 8.9% m/m and 11.3% y/y in August, considerably worse than the 6% and 4.7% drops in July. Additionally, economists expected the y/y metric to show a gain of 1%. The city-nation, which has traditionally run trade deficits with the US, experienced a 28% y/y decline in shipments to the world’s largest economy after a 42.8% July drop, a result of the US imposing a 10% tariff on the country. This tax caused US importers to increase orders prior to the levy being implemented, reducing demand for the country’s products during the past two months. Cargo shipped to Indonesia and China also weakened but the European Union, Taiwan and South Korea increased their purchases of Singapore products. Even with the drop in trading with the US, China and Indonesia, Singapore produced a 5.07 billion SGD trade surplus, although the net result was lower than 6.35 billion SGD in July.
For specific platform feedback and suggestions, please submit it directly to our team using these instructions.
If you have an account-specific question or concern, please reach out to Client Services.
We encourage you to look through our FAQs before posting. Your question may already be covered!
Information posted on IBKR Campus that is provided by third-parties does NOT constitute a recommendation that you should contract for the services of that third party. Third-party participants who contribute to IBKR Campus are independent of Interactive Brokers and Interactive Brokers does not make any representations or warranties concerning the services offered, their past or future performance, or the accuracy of the information provided by the third party. Past performance is no guarantee of future results.
This material is from IBKR Macroeconomics, an affiliate of Interactive Brokers LLC, and is being posted with its permission. The views expressed in this material are solely those of the author and/or IBKR Macroeconomics and Interactive Brokers is not endorsing or recommending any investment or trading discussed in the material. This material is not and should not be construed as an offer to buy or sell any security. It should not be construed as research or investment advice or a recommendation to buy, sell or hold any security or commodity. This material does not and is not intended to take into account the particular financial conditions, investment objectives or requirements of individual customers. Before acting on this material, you should consider whether it is suitable for your particular circumstances and, as necessary, seek professional advice.
Related Articles


")


Most of these economic numbers don’t look too good.