
- Solve real problems with our hands-on interface
- Progress from basic puts and calls to advanced strategies
Interactive Options Course

Posted September 11, 2025 at 1:18 pm
This morning’s in-line CPI report alongside the loftiest level of initial unemployment claims in almost four years is sending equities to the nosebleeds and yields to the basement. Stocks hit fresh all-time highs yet again after the economic data signaled labor market weakness that is bolstering rate cut probabilities into year-end and beyond. Indeed, fixed-income watchers are penciling in approximately 75 bps of reductions by Christmas and another three-quarters before 2026 closes with expectations that the Fed will prioritize the employment side of its dual mandate. But the enthusiasm may be unwarranted, especially since core inflation has accelerated for the third consecutive month amidst the CPI reflecting broad-based increases amongst tariff-sensitive areas, like automobiles and apparel. Still, Wall Street is taking its cue from the Trump administration adamantly seeking lighter costs of capital and the buoyancy is evident by shares advancing across every major sector and sub-component. The Treasury curve is plunging in bull-flattening fashion, meanwhile, led by duration, as slowdown worries permeate through the government debt complex. Bitcoins and forecast contracts are also catching bids as well as the non-energy commodities. Prices for volatility protection instruments and the greenback are sinking due to weakening hedging demand and cheaper domestic credit.
Inflation accelerated last month amidst broad-based increases across non-housing services, shelter, goods and commodities. The headline Consumer Price Index (CPI) climbed 0.4% month over month (m/m) and 2.9% year over year (y/y), a tenth of a percent hotter than expectations for the former but in line with projections for the latter. The results were much loftier than July’s 0.2% and 2.7%. The core version of the indicator, meanwhile, ascended 0.3% m/m and 3.1% y/y, matching both the estimates and the prints from the previous period.
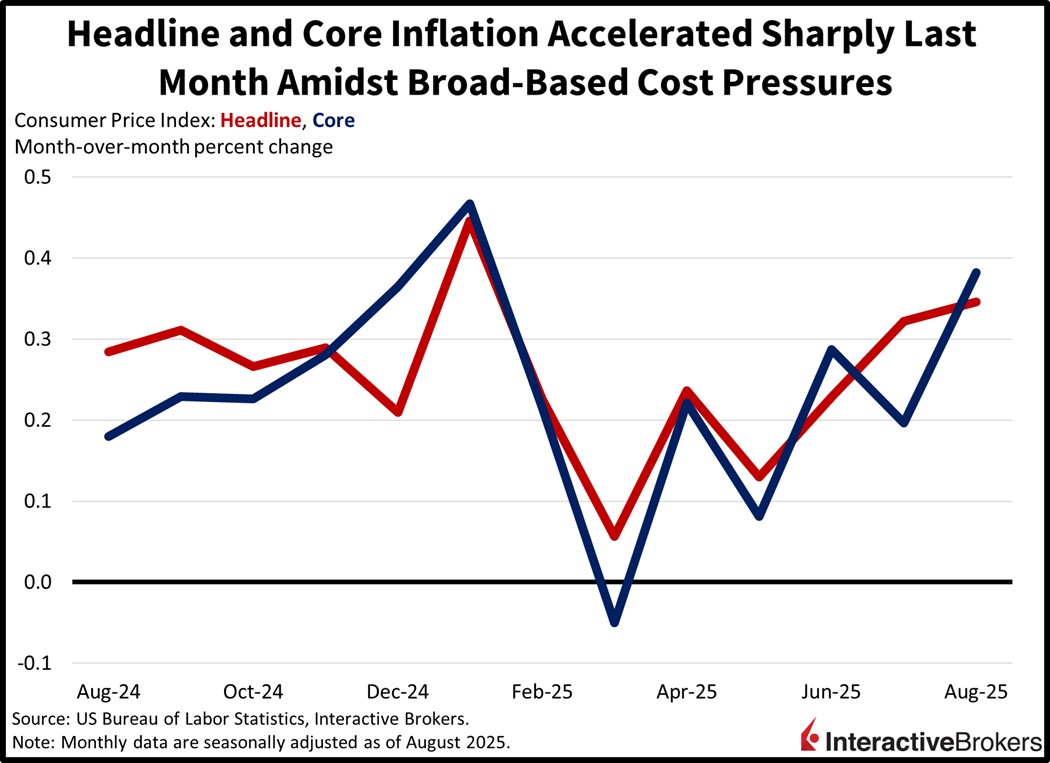
There were only a few spots of relief within the report amidst positive contributions from most areas. Indeed, the gasoline, used automobiles, transportation services and food at markets categories underpinned the accelerating reading, with costs rising 1.9%, 1%, 1% and 0.6% m/m during the period. Apparel, shelter, food at restaurants, and new cars rose at more modest degrees of 0.5%, 0.4%, 0.3% and 0.3%. Conversely, energy services (electricity and heating) and medical care services experienced deflation of 0.2% and 0.1% m/m. Shelter is a critical component comprising almost half of the CPI basket and it sprinted to its fastest monthly gain in 12 months. Another troubling trend is that vehicles have aggressively reversed from their declines. But an increasingly constructive consideration is that cost forces are also being driven by cyclically oriented elements dependent on discretionary consumer demand, like airfares and hotels, which advanced rapidly.
Initial unemployment claims rose to the highest level since October of 2021, signaling employers’ declining labor appetite. But the figures are notoriously volatile especially during the Labor-Day shortened week ended on September 6. Still, the 263k applications were much heavier than the 235k median estimate and the prior period’s 236k. Continuing filings were more tempered, however, arriving at an unchanged 1.939 million throughout the seven-day interval culminating on August 30, which was beneath the 1.950 million expected. Four-week moving averages shifted in bifurcated fashion from 231k and 1.947 million to 241k and 1.946 million.
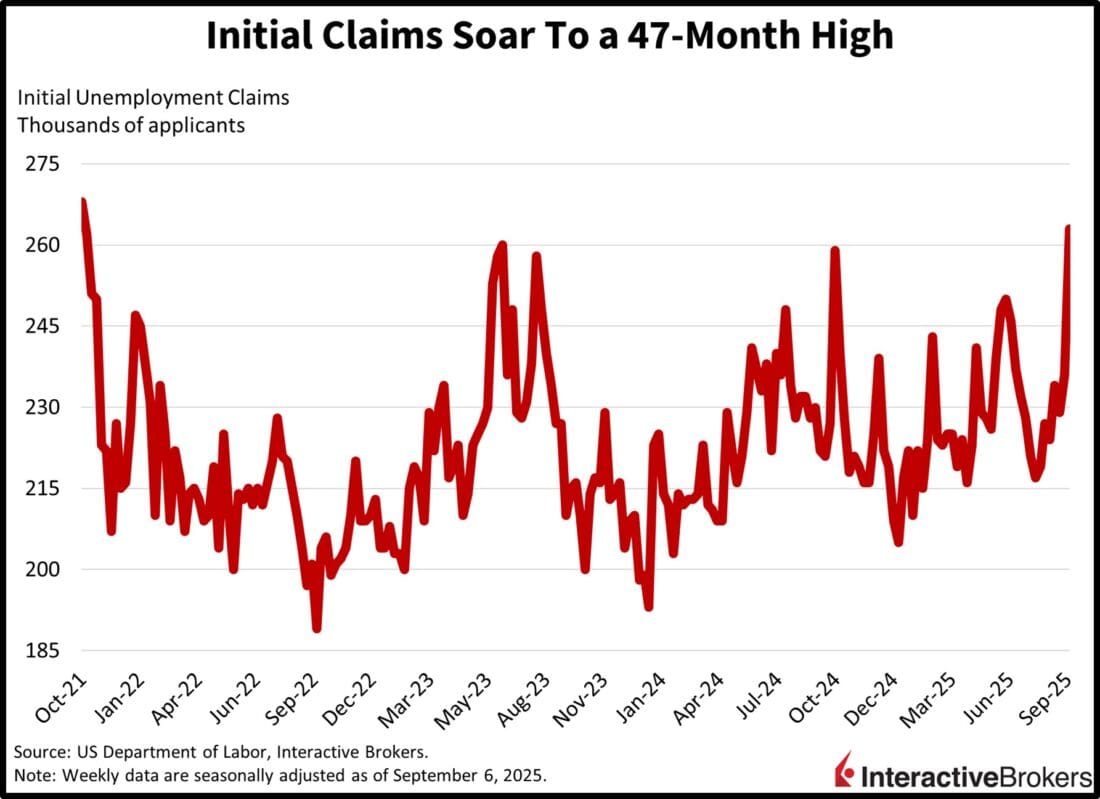
Initial unemployment claims rarely move the market more than the CPI, but today’s 47-month high in weekly layoffs was a heavier influence on Wall Street. The labor side of the Fed’s mandate began to gain increasing significance following the loss of jobs throughout the Great Financial Crisis. It took the US 76 months, from December 2007’s peak to April 2014 to recover from the significant 8.7 million reduction in payrolls. Since then, policymakers have been reluctant to allow joblessness to rise, and that’s part of the reason why investors today are excited about rate cuts despite inflation reflecting a broad acceleration. And a justification as to why price pressures are brewing is a reaccelerating economy, as servicer pricing power has been enhanced by robust consumer demand bolstered by employment conditions that are still solid amidst asset prices that continue their relentless climb. However, goods and shelter caught a tailwind as well, partially because of cheaper borrowing costs stimulating activity in the automobile and housing sectors, although tariff forces do remain a risk even though they haven’t had a meaningful impact yet and I don’t envision that they will in the future.
The European Central Bank kept its deposit rate at 2% this morning—its second consecutive month of no change to the benchmark—and reiterated that it has won the battle against inflation and that economic risks have eased. The decision was expected by a consensus of economists and comes as inflation has been only slightly above the organization’s 2% goal. ECB President Christine Lagarde and her policymaker peers offered no guidance on future policy decisions, but she opined that the outlook for price changes is highly uncertain due to volatility in global trade. A potential escalation in trade tensions could cause a further slowdown in exports, investment and consumption. Markets are currently implying that investors believe that ECB will hold its rate steady for the remainder of the current economic cycle.
Wholesale prices in August declined relative to the preceding month but were still up 2.7% y/y, according to the Corporate Goods Price Index, which is also referred to as the Producer Price Index. Businesses fetched 0.2% less in August m/m, a worse decline than the 0.1% drop expected by a consensus of economists. In July, the metric was up 0.3%. The gauge was also elevated 2.7% y/y last month, matching the forecast and accelerating from 2.5% in the preceding period. For the m/m print, the electric power, gas and water group and the agriculture, forestry and fishery products category and metal fell 0.22%, 0.5% and 0.3%, respectively. Those changes were partially offset by petroleum and coal products, beverages and foods and transportation equipment stickers climbing 0.5%, 0.3% and 0.3%.
Also in August, export prices sank 0.1% while import costs were unchanged. Regarding products shipped abroad, general purpose, production and business-oriented machinery providers received 0.14% more for their products. Transportation equipment, other primary products and manufactured goods and chemicals declined marginally. Purchasers of general purpose, production and business-oriented machinery, however, dished out 0.9% and 0.7% more when importing those items. Metals fell 0.10% while declines for beverages and foods, electric and electric products, other primary products and manufactured goods were negligible.
Consumers in Australia believe inflation will hit 4.7% during the coming 12 months, according to the Melbourne Institute Survey of Inflation Expectations. The result is up from the 3.9% 12-month expectation in August.
Information posted on IBKR Campus that is provided by third-parties does NOT constitute a recommendation that you should contract for the services of that third party. Third-party participants who contribute to IBKR Campus are independent of Interactive Brokers and Interactive Brokers does not make any representations or warranties concerning the services offered, their past or future performance, or the accuracy of the information provided by the third party. Past performance is no guarantee of future results.
This material is from IBKR Macroeconomics, an affiliate of Interactive Brokers LLC, and is being posted with its permission. The views expressed in this material are solely those of the author and/or IBKR Macroeconomics and Interactive Brokers is not endorsing or recommending any investment or trading discussed in the material. This material is not and should not be construed as an offer to buy or sell any security. It should not be construed as research or investment advice or a recommendation to buy, sell or hold any security or commodity. This material does not and is not intended to take into account the particular financial conditions, investment objectives or requirements of individual customers. Before acting on this material, you should consider whether it is suitable for your particular circumstances and, as necessary, seek professional advice.
Trading in digital assets, including cryptocurrencies, is especially risky and is only for individuals with a high risk tolerance and the financial ability to sustain losses. Eligibility to trade in digital asset products may vary based on jurisdiction.
Futures are not suitable for all investors. The amount you may lose may be greater than your initial investment. Before trading futures, please read the CFTC Risk Disclosure. A copy and additional information are available at ibkr.com.
Related Articles


Join The Conversation
For specific platform feedback and suggestions, please submit it directly to our team using these instructions.
If you have an account-specific question or concern, please reach out to Client Services.
We encourage you to look through our FAQs before posting. Your question may already be covered!