
- Solve real problems with our hands-on interface
- Progress from basic puts and calls to advanced strategies
Interactive Options Course
Posted August 11, 2025 at 1:12 pm
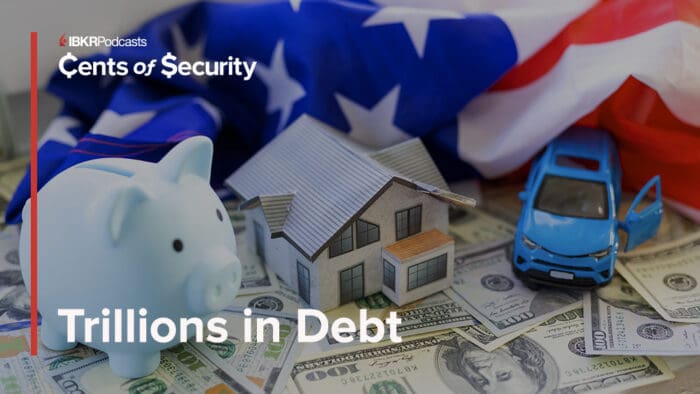
The US National Debt is a popular topic, but what makes up that number and more importantly how did we get to such a big number? Nicholas Colas, Co-Founder at DataTrek Research joins Cassidy Clement to discuss.
Cassidy Clement
Welcome back to the Cents of Security podcast. I’m Cassidy Clement, Senior Manager of SEO and Content at Interactive Brokers, and today I’m your host for the podcast. Our guest is Nicholas Colas, Co-founder of DataTrek Research.
The U.S. national debt is a very popular topic, but what makes up that number? And more importantly, how did we get to such a big number? These are the types of questions and details we’re going to go over in today’s episode.
Welcome to the program, Nick.
Thank you very much.
Yeah, of course. So, since this is your first episode, why don’t you tell the listeners a little bit about how you got your start in the industry.
Sure. I’m a 40-year veteran of Wall Street. I started work in the 1980s at a firm called Alliance Capital, which was then just starting a big mutual fund business. So, I grew with that business, went to Chicago for business school, and since the early 1990s, I’ve been an auto analyst at Credit Swiss First Boston. I worked for Steve Cohen for three years at the old S.A.C Capital. I’ve run research desks across the street, and for the last eight years, I and a partner have run Data Research, which is a daily market newsletter.
Awesome. So, it seems like you’re the perfect guest for this. Just to jump right in—we always hear about the U.S. national debt. It’s probably something that you learn about in, like, fourth grade in the American public schooling system. You hear about this looming “Oh, the U.S. national debt,” or maybe you take a school trip to New York City and see that huge number changing on one of the buildings. But what exactly makes up that national debt? What are the elements or the loans, or maybe the types of debt, that go into that ginormous number we see today?
It is a huge number. You know, the total is about $37 trillion—obviously, a number almost beyond comprehension. Thirty trillion of that is U.S. debt. It’s the bonds that you see perhaps when you go on a website and look at the interest rate on 10-year Treasuries. The majority of that is issued by the U.S. government and purchased by the public, by people, by institutions.
Most of that debt—say, about 50-odd percent—is debt issued for 10 years or less, so a little bit on the shorter side of the curve. But there is Treasury debt that goes all the way out to 30 years. The other $7 trillion is debt that the government issues to itself, primarily for things like Social Security and other long-term benefit programs. It issues it directly to those parties and basically pays itself. But the vast majority of the stuff we’ll be talking about today is the debt owned by the public—that $30 trillion worth of debt.
So, when we’re looking at this U.S. debt from more of the economic perspective—not just breaking it down, but actually saying, “Okay, we have this huge number—what are the impacts? What exactly does it even allow the government to accomplish?” Or maybe, “What does it allow citizens to accomplish?” Because you may look at it and say, “That’s huge. Shouldn’t that have adverse economic impact at all times if it’s that big?”
Yeah. Let’s just talk about what the debt does. The first thing it does is simply allow the government to fund all the programs that Congress has approved. We get tax revenues—we get things from individuals, we get taxes from corporations, we get excise taxes, and now we’re getting some tariff income as well. That’s not enough to actually fill the government budget, and so the government issues debt in order to fill that gap.
In addition, the government will occasionally stimulate the economy during a recession by issuing incremental debt and either paying people directly or doing other programs to try to stimulate the economy. And, as we’ll discuss, you’ll see that a lot of the government debt we have now is because of prior programs—like during the pandemic or after the recession in 2008.
The debt itself—it’s a funny thing to say, but that $30 trillion of debt makes it a must-own security for virtually any institution in the world in some form. So not only do individuals own that debt, but governments own it, other central banks own it, foreign institutions own it. It’s a very popular investment because it’s considered the safest investment in the world. Even at $30 trillion, U.S. Treasuries are the notionally risk-free asset in the entire economic system. They’re the foundation of everything that runs everything else. It’s a fascinating thought that it can be so large and still so well regarded, but that’s where we are.
Yeah. You mentioned the element about it being regarded—the U.S. as a country—it’s relatively new. It’s new on the scene; it’s only a couple hundred years old. So, you look at the debt maybe from a timeline perspective: if you’re someone like myself who’s a millennial, you can recognize those events you just mentioned—maybe 2008 or COVID—where you were old enough to understand when people were saying, “Oh, the national debt is going to increase because of these programs, or because of this relief, or this stimulus.”
So, how long really has the debt been recognized? And are there other historical moments associated that people may think about when they’re studying how the number got to where it is—or why so many other outside countries are saying, “Oh, this is a consistent good investment”? They’ve had many aspects or time frames or historical events as to why this is something that gets paid back or is worth holding.
Sure. Hey, the big headline here is the U.S. government has never defaulted on any debt—ever. The practical history of this concept goes back to World War II. When the U.S. and the Allies won World War II, the U.S. had issued a ton of debt in order to fund that war, and it ended up working out in the U.S.’s favor, obviously.
That was really, I think, the anchor moment—the post–World War II moment—when the U.S. became the center of the global financial system. It became what’s called the reserve currency. The dollar is the reserve currency of the world, meaning that when you want to buy something important—like oil or gold—you have to pay for it in dollars anywhere in the world. No other currency, broadly speaking, is accepted.
So, we have to also talk about the reserve currency status of the dollar in order to understand why Treasuries are so valued—why Treasuries are so important to the system—because they represent dollars to most of the world.
Fast forward: World War II happens, the U.S. wins, debt-to-GDP had gotten to 120%. It fell, and that’s the measure we use—how much debt is there relative to economic output. It then fell all the way down to the low 30% range by the 1960s, and then it began to climb ever higher. I can recall going to lectures in the 1980s and 1990s in business school and thereafter, from very important people—real thought leaders—who were very worried about the deficit when it was 40% or 50% of GDP.
It’s now 120% of GDP, and we’re still having this discussion. Interest rates are much lower than they were in the 1980s, when they were 15%, 16%, 17%. They’re 4% now. So, it’s hard to argue that this rising deficit—this rising level of debt—has actually made U.S. debt more expensive. And the reason is that the U.S. is considered the safest of all havens. The dollar is a safe haven, and Treasuries are a very safe asset.
Yeah, there have been so many elements of concern—especially when you learn about personal finance. Initially, you say you don’t want to have your liabilities outweigh your assets or things of that nature. So, when you start to look at this number, if one was to make a statement out of deductive reasoning, they may look at that and say, “The U.S. economy seems to be one of the economic megapowers of the world—so how did it even continue to get that high?” Was there ever a time it was fully lowered or maybe even zero? Were there any times like that?
Yes, there was one very specific time—at the end of the 1990s, 1999 and 2000—when the stock market had been ripping for years and the dot-com bubble was in full bloom. During that time, there was no incremental debt issued; the U.S. actually balanced a budget. You didn’t have to issue more debt because tax receipts were so high, there was very full employment, and there was very high labor force participation.
A lot of people were working—the maximum level in the population that we’ve ever seen. That was a very brief period—literally two years, 1999 and 2000—when the government didn’t have to issue incremental debt. It had pre-existing debt but didn’t have to issue much more. Aside from that, there’s always been a structural budget deficit that has forced the government to issue more debt, and this debt-to-GDP number keeps rising.
Yeah, that’s so interesting. As a millennial, I remember hearing always chirps about that—at one point it was really low, or it was almost zero. And like I mentioned earlier, I remember taking the field trips and seeing that number on the side of the building in Manhattan, and you just can’t even fathom what that actually equates to.
That kind of leads me into my next question—which is the positives and negatives associated with that high of a number, or in the flip side, that low of a number. Because as you mentioned previously, some other nations will look to U.S. debt as a safe security to invest in.
Yes. Again, it’s sort of a fascinating dichotomy—so much debt and so much incremental debt issuance, and yet, if you look at interest rates today, they’re about 4.3%–4.4% on 10-year Treasuries, which is the benchmark that Wall Street looks at—the 10-year Treasury yield.
It was exactly the same in 2004, 2005, and 2006—right before the financial crisis—and debt-to-GDP then was 60%. Now it’s 120%. So, debt-to-GDP has doubled, and yet interest rates are exactly the same.
I think you raised exactly the right point: the fundamental reason Treasury yields haven’t gone anywhere—even though debt-to-GDP has doubled—is because of the strength of the U.S. economy and particularly the strength of U.S. innovation. If you think about the biggest companies in the S&P—the Nvidia’s, Microsoft’s, Apple’s—these are global companies. I don’t think it’s too much to say that the internet, in the world outside of China, is literally ultimately priced in dollars.
It’s the power of American innovation that makes this country’s economic underpinning so strong and makes Treasuries the safe asset. If the U.S. didn’t have that kind of innovation—if the U.S. didn’t lead the world in technology—then it might not have the same relevance. So, it’s not just the things people talk about like the laws of our country, the long-term record of never defaulting on debt, or winning a big war. All of those things add up, but we also have to include the fact that the U.S. is an economic powerhouse and continues to move from strength to strength with things like Gen AI.
It looks very clear that Gen AI is going to be a U.S. product for the world. There are very few outside competitors. So, when you layer it all together, the Treasury is not just a function of the budget deficit or the U.S. government—it’s also a function of the dynamism of the American economy and giving the world confidence that the U.S. can continue to grow and keep servicing this debt.
You hit on this a little bit about the innovation within the country that can bleed into, of course, employment opportunity and new industry. But what exactly is the impact of a high or low national debt on retail investors—or how people would see this on Main Street, let’s say, instead of Wall Street? I know that question comes up often when you have COVID-19 impact on numbers, 2008 impact on numbers—people say, “How could I have seen this?” or “Why am I seeing this now if it was a problem prior?”
The primary issue for retail investors—and even if you’re not an investor, just somebody who wants to buy a house or take out a loan to buy a car—is that Treasury yields are the bedrock from which all of those other loans are priced. So, if Treasury yields are 1% versus 4%, then the cost of a mortgage is going to be lower, the cost of a car loan is going to be lower.
We saw that in 2021 and 2022, when 10-year yields were around 1% and mortgages were in the 3% range, and car loans were in the 5% range. Now, Treasuries are 4%, and all those loans are a lot more expensive. Mortgages are like 7%–7.5% now. So, it directly impacts literally every citizen who wants to take out a loan in any form. It’s a super important concept.
And the fact that Treasuries now are 4%, and they really were never at 4% during the 2010s, makes it feel like a much more onerous problem because it affects everything else. You want to buy a house—you’re effectively paying Treasury yields plus. Same with buying a car. So, you’re pointing in the right direction: it’s important to everybody, whether you’re an investor or not.
Because of the nature of what you do—research, and looking at things from a historical perspective—when you’re saying it seems like “Treasury yields plus,” is there anything that you’ve observed in the current market, or maybe are starting to see as trends in the market, as institutions realize, “This is what we’re offering to our customers—how are we going to market this as it’s harder and harder for people to secure loans?”
Yes. You’re right—it’s a challenge because, on the one hand, the typical person will want to buy a house, and they’re going to go to the bank and say, “Okay, I’d like a mortgage.” They’re going to look at the monthly payment they have to make, and in many cases say, “I’ve got to pick a less expensive house, or maybe I can’t even buy a house.”
It’s been a particularly huge problem for your demographic cohort—looking to buy their first home. If you didn’t buy a house in 2011–2022, when rates were low, you might be priced out of the market now, and it might not even be a possibility to buy a house. So, it really comes not so much from the institutional side trying to sell something, as just the numbers—the facts—hitting the road and the numbers not working for a lot of people.
It’s also even in credit card rates. The average credit card rate has gone from about 15% interest to about 21% as interest rates have gone up on Treasuries. Companies can try to market through it by offering points or discounts or other features, but the underlying economic reality is very tough.
Yeah, I think that definitely also bleeds into, we’ll say, the real young adults. As the older cousin of many younger cousins, I see those types of thoughts or gears turning in their heads as they start to look at colleges or trade schools, or decisions for after high school—thinking, “Okay, so if I can’t have a car and I need to take out loans for school, how exactly will I pay these back?”
I think it’s really evident now—and it’s probably because the world’s a lot more flat—people can get information a lot quicker about the ways that U.S. national debt impacts people past their portfolio, or past the idea of, “Oh, it’s just the financial advisor’s problem, it’s not my problem.” People are starting to see it hit their wallets a lot closer to home—literally.
Yeah. The offset—it doesn’t help in terms of the raw reality you just described—the good thing is that even though the debt-to-GDP, or debt, has doubled since 2005, interest rates are exactly the same. So, it’s not like the debt has actually pushed rates up. I know we read about that a lot in the paper, but the historical data is very clear: it’s not the debt pushing it up.
It’s that the economy is much stronger than it was in the 2010s. The 2010s were a very tough time for a lot of people—unemployment was very high and stayed high, economic growth was very slow for six or seven years after the Great Recession. Thankfully, we’re not yet at a point where we’re paying the price for these deficits. We’re really reflecting a stronger level of economic growth. Unemployment is very low; wage growth is very good—so there are some underlying economic positives.
But your underlying point is well taken—which is, in some ways, it doesn’t matter. Rates are just much higher than they were in the 2010s, so your demographic cohort—and the ones behind you—are really paying the price, if you will, for having higher Treasury yields. But it’s not a function of the deficit or excess spending; it’s really a function of the economy being much better than it was in the last decade.
That’s a really interesting point. And it’s almost a juxtaposition of “How much of a good thing do you want to experience?”—because it almost seems like you’re seeing all these positives and then you end up reaping what you sow in a negative way.
Yes. It’s, “Would you rather be employed and have a 3%–4% annual wage increase, or would you rather have 1% Treasury yields?” Most people, I think, would want to take the former—because it means they’re employed, they’re getting raises, they’re living their life—versus being unemployed and not being able to take advantage of lower yields by buying a house or a car.
That’s a really good point. You brought up some great notes and points today, Nick. Thanks so much for joining us.
Thank you.
Yeah, of course. And as always, listeners can learn more about an array of financial topics for free at interactivebrokers.com/campus. Follow us on your favorite podcast network and feel free to leave us a rating.
Information posted on IBKR Campus that is provided by third-parties does NOT constitute a recommendation that you should contract for the services of that third party. Third-party participants who contribute to IBKR Campus are independent of Interactive Brokers and Interactive Brokers does not make any representations or warranties concerning the services offered, their past or future performance, or the accuracy of the information provided by the third party. Past performance is no guarantee of future results.
This material is from DataTrek Research and is being posted with its permission. The views expressed in this material are solely those of the author and/or DataTrek Research and Interactive Brokers is not endorsing or recommending any investment or trading discussed in the material. This material is not and should not be construed as an offer to buy or sell any security. It should not be construed as research or investment advice or a recommendation to buy, sell or hold any security or commodity. This material does not and is not intended to take into account the particular financial conditions, investment objectives or requirements of individual customers. Before acting on this material, you should consider whether it is suitable for your particular circumstances and, as necessary, seek professional advice.


Join The Conversation
For specific platform feedback and suggestions, please submit it directly to our team using these instructions.
If you have an account-specific question or concern, please reach out to Client Services.
We encourage you to look through our FAQs before posting. Your question may already be covered!