
- Solve real problems with our hands-on interface
- Progress from basic puts and calls to advanced strategies
Interactive Options Course

Posted August 1, 2025 at 11:45 am
This week, we cover two large cap ‘Expensive but Worth It’ U.S. names, V and EA. The firms published their quarterly release on Tuesday and reported better than expected earnings. V’s earnings beat estimates on strong growth in international payments volume. EA also posted strong numbers, with EVA Momentum now on the verge of inflecting positive, supported by strong growth in the PC segment.
Amidst slow progress on the trade deal and the recently announced 25% tariff by U.S. President Trump on Indian goods imports, we look at India through the EVA lens to see how equities in the country look at this stage and what has historically worked over the short- to long-term. We also look at some of the major BRICS economies to see how the grouping has fared in the past from an EVA perspective.
With the announcement of a trade deal between the European Union and the U.S. on July 27, 2025, we look to see which European names may look the most attractive given the imposed 15% tariffs. To determine the list, we looked at the average market return from July 26, 2025, to July 30, 2025, for all European Union companies under coverage. We then computed the average return for each industry, as well as the median return of all companies. Industries with average returns greater than the median return were considered more tariff resistant.
The Global Beverages industry has seen both the level, and the trend of economic profitability face downward pressure over the last two years with large cap companies reporting declining volumes in the North American and European markets across all three segments of the industry: Soft Drinks & Non-alcoholic Beverages, Brewers, and Distilleries & Vintners.
On average, Large Cap firms look attractive in the PRVit framework with strong EVA Fundamentals in the last quarter. EVA Margin and EVA Momentum dipped in Q1 2025 but have inflected up at the end of Q2 2025. Both metrics are above their longer-term averages. Investors had been pricing in a decline in profitability at the beginning of the year but are now expecting incremental growth.
We identify attractive names in our Global ex U.S. Large Cap universe with strong EVA growth scores (Profitability Trend, P2), attractive PRVit, and strong ESG Performance Scores. The PRVit framework compares a firm’s operational Quality to the Value paid in the market: the greater the disconnect between Quality and Value, the more favorable the stock.
We search for firms with cheap Value scores and strong ESG Performance scores within the Global ex U.S. Large Cap universe. Along with the picks, we include an update for our previous reports. These updates include a flag to indicate whether the firms continue to meet the criteria.
PRVit spreads were positive in AxJ, Japan, and the Emerging Markets through the final week of July. Quality continued to struggle everywhere. Cheap Value outperformed expensive Value in all regions except the U.K.
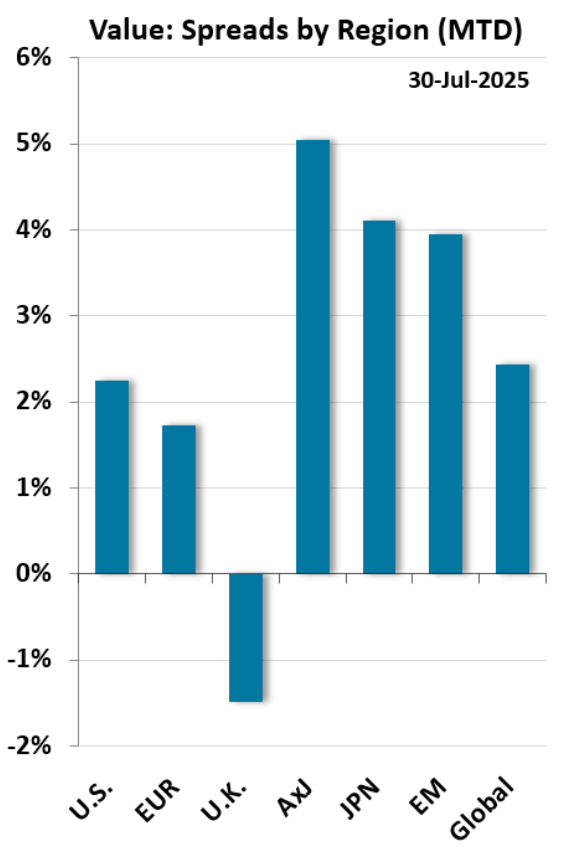
We saw the Value trade pick up in June and the trade continued to work through July. The Chart of the Week shows cheap firms outperforming expensive firms across all regions except the U.K. On the flip side, Quality (P-R) continued to struggle through July, with all regions seeing negative spreads for the factor. See this week’s Quant Corner for more results.
—
Originally Posted on July 31, 2025
Information posted on IBKR Campus that is provided by third-parties does NOT constitute a recommendation that you should contract for the services of that third party. Third-party participants who contribute to IBKR Campus are independent of Interactive Brokers and Interactive Brokers does not make any representations or warranties concerning the services offered, their past or future performance, or the accuracy of the information provided by the third party. Past performance is no guarantee of future results.
This material is from ISS EVA and is being posted with its permission. The views expressed in this material are solely those of the author and/or ISS EVA and Interactive Brokers is not endorsing or recommending any investment or trading discussed in the material. This material is not and should not be construed as an offer to buy or sell any security. It should not be construed as research or investment advice or a recommendation to buy, sell or hold any security or commodity. This material does not and is not intended to take into account the particular financial conditions, investment objectives or requirements of individual customers. Before acting on this material, you should consider whether it is suitable for your particular circumstances and, as necessary, seek professional advice.
Related Articles
 Simulation")


Join The Conversation
For specific platform feedback and suggestions, please submit it directly to our team using these instructions.
If you have an account-specific question or concern, please reach out to Client Services.
We encourage you to look through our FAQs before posting. Your question may already be covered!