
- Solve real problems with our hands-on interface
- Progress from basic puts and calls to advanced strategies
Interactive Options Course
Posted August 1, 2025 at 6:19 am
1/ As Go the MNM’s, So Goes the Market
2/ Declining Volume Hints at Waning Momentum
3/ Tesla Remains a “Sit on Your Hands” Play
Investopedia is partnering with CMT Association on this newsletter. The contents of this newsletter are for informational and educational purposes only, however, and do not constitute investing advice. The guest authors, which may sell research to investors, and may trade or hold positions in securities mentioned herein do not represent the views of CMT Association or Investopedia. Please consult a financial advisor for investment recommendations and services.
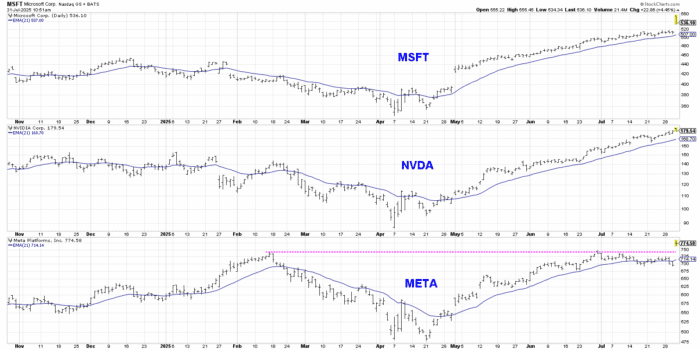
As Go the MNM’s, So Goes the Market
In a week where four of the Magnificent 7 stocks are reporting earnings, it becomes crystal clear that the trend in the broader markets is essentially driven by the trends in these mega cap growth stocks. Shares of Meta Platforms (META) are anticipated to break out after a strong earnings beat, meaning META, Nvidia (NVDA) and Microsoft (MSFT) will all be in primary uptrends.

The strength in these three charts represents three winning themes since the April 2025 market low: cloud computing, artificial intelligence, and social media. And while Nvidia will report earnings next month, both Microsoft and Meta registered solid results this week. Assuming a post-earnings breakout for META, confirming a move above resistance around $740, I’ll focus on following these trends as long as possible. The 21-day exponential moving average should serve as an effective tool to track these uptrends in the coming weeks.
Declining Volume Hints at Waning Momentum
Any time a market is moving to new highs, I like to regularly review the evidence to look for any signs of trend exhaustion. For the S&P 500 index, I’m noting weakening volume readings which could be an early sign of a lack of willing buyers.
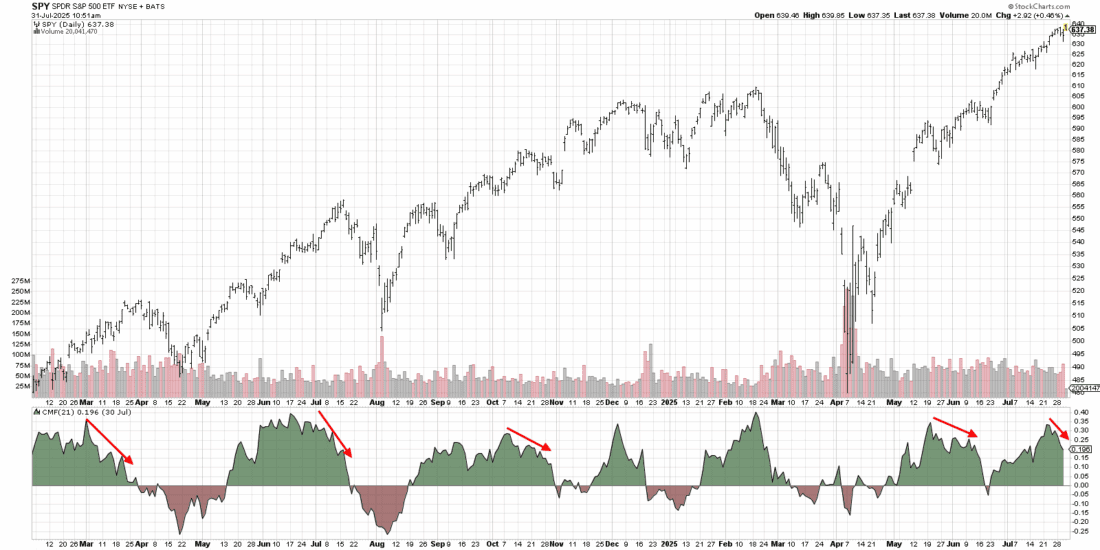
We’re using the Chaikin Money Flow (CMF) in this chart, which is a volume indicator created by Marc Chaikin to track volume trends weighted by daily price performance. With the CMF well into positive territory, this would suggest that the S&P 500 is in an accumulation phase. But a closer look reveals a bearish divergence between price and the CMF over the last two weeks.
This suggests that recent down closes on heavier volume represent distribution as investors sell into recent market strength. If the Chaikin Money Flow would drop below the zero level in the coming weeks, that would be in line with previous pullbacks where a divergence preceded a meaningful decline as sellers took control.
Tesla Remains a “Sit on Your Hands” Play
Earlier this week we referenced a classic Jesse Livermore quote about the “time to go fishing” chart, and used Starbucks (SBUX) to illustrate a consolidation phase. The key with this type of chart is to wait for the market to make its move, with a breakout from the pattern as confirmation of the new direction. Shares of Tesla (TSLA) are demonstrating a very similar phenomenon but with a coil pattern of lower highs and higher lows.
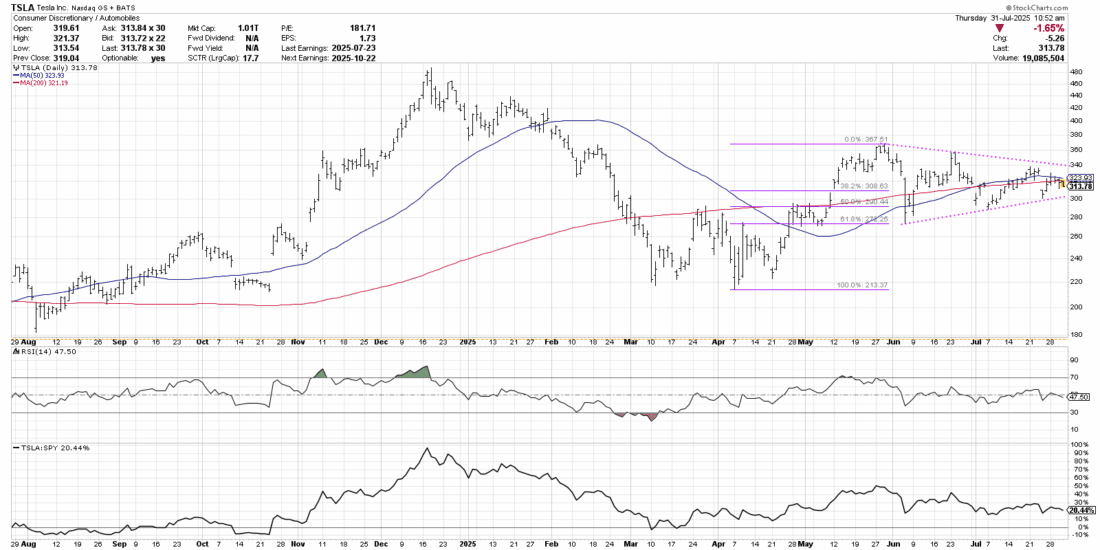
A symmetrical triangle or “coil” pattern is formed when a stock experiences a strong move in one direction followed by a narrowing of the range. The price basically fluctuates higher and lower around an equilibrium price, which in the case of TSLA sits around $320. Note that the 50-day and 200-day moving averages have flattened out and the RSI is almost dead neutral at 50. Both of these features serve to confirm the sideways price action.
At this point, a rally above resistance around $340 would exit the triangle pattern to the upside, clearing the mid-July swing high and unlocking further upside targets. On the other hand, a drop below $300 would confirm a breakdown scenario, making a new swing low and suggesting downside to at least the 38.2% Fibonacci retracement level around $270. But until we see a breakout from this consolidation pattern, investors could be best served by remaining patient.
—
Originally posted 31st July 2025
Investopedia.com: The comments, opinions and analyses expressed herein are for informational purposes only and should not be considered individual investment advice or recommendations to invest in any security or to adopt any investment strategy. While we believe the information provided herein is reliable, we do not warrant its accuracy or completeness. The views and strategies described on our content may not be suitable for all investors. Because market and economic conditions are subject to rapid change, all comments, opinions and analyses contained within our content are rendered as of the date of the posting and may change without notice. The material is not intended as a complete analysis of every material fact regarding any country, region, market, industry, investment or strategy. This information is intended for US residents only.
Information posted on IBKR Campus that is provided by third-parties does NOT constitute a recommendation that you should contract for the services of that third party. Third-party participants who contribute to IBKR Campus are independent of Interactive Brokers and Interactive Brokers does not make any representations or warranties concerning the services offered, their past or future performance, or the accuracy of the information provided by the third party. Past performance is no guarantee of future results.
This material is from Investopedia and is being posted with its permission. The views expressed in this material are solely those of the author and/or Investopedia and Interactive Brokers is not endorsing or recommending any investment or trading discussed in the material. This material is not and should not be construed as an offer to buy or sell any security. It should not be construed as research or investment advice or a recommendation to buy, sell or hold any security or commodity. This material does not and is not intended to take into account the particular financial conditions, investment objectives or requirements of individual customers. Before acting on this material, you should consider whether it is suitable for your particular circumstances and, as necessary, seek professional advice.
Any discussion or mention of an ETF is not to be construed as recommendation, promotion or solicitation. All investors should review and consider associated investment risks, charges and expenses of the investment company or fund prior to investing. Before acting on this material, you should consider whether it is suitable for your particular circumstances and, as necessary, seek professional advice.
Related Articles


Join The Conversation
For specific platform feedback and suggestions, please submit it directly to our team using these instructions.
If you have an account-specific question or concern, please reach out to Client Services.
We encourage you to look through our FAQs before posting. Your question may already be covered!