


As investors prepare for a deluge of consequential data this week – in the next three days, really – some may be surprised by the relative complacency shown by volatility measures. Bearing in mind our standard disclaimer that “VIX is not a fear gauge, it just plays one on TV”, there is a reasonable rationale for the apparent ennui.
I am typing this with the Cboe Volatility Index (VIX) displaying a reading below 15. Mind you, this is ahead of a three-day stretch that includes, among other items:
- Tomorrow: 2Q GDP before the open; an FOMC rate decision and Powell press conference at 2pm EDT; earnings from Microsoft (MSFT) and Meta Platforms (META) after the close
- Thursday: Core PCE before the open; earnings from Apple (AAPL) and Amazon (AMZN) after the close
- Friday: The July jobs report, including Nonfarm Payrolls and Unemployment, before the open; University of Michigan Sentiment at 10am EDT
The current 14.97 is not exactly the lowest level for this calendar year – that would be the 14.58 level that was touched on January 24th – but we are awfully close.
VIX, 1-Year, Daily Candles
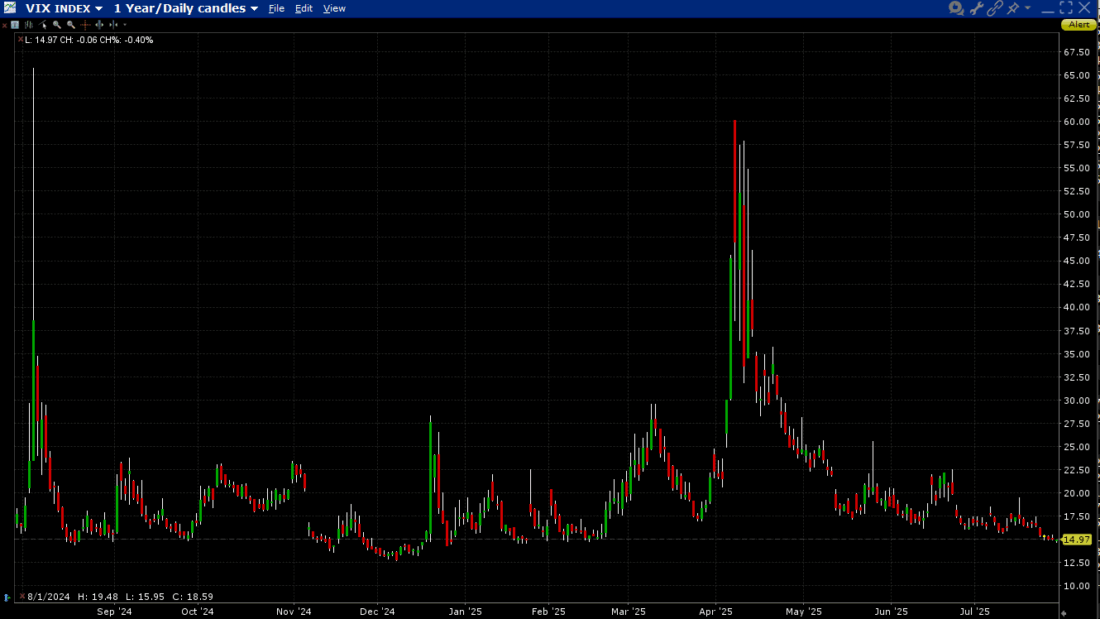
Source: Interactive Brokers
Bearing in mind that Cboe defines VIX as
…a calculation designed to produce a measure of constant, 30-day expected volatility of the U.S. stock market, derived from real-time, mid-quote prices of S&P 500® Index (SPX℠) call and put options
some still might wonder why market expectations for volatility over the coming 30 days might be so low. Some may also be curious about why the VIX9D index, which uses the same methodology as VIX while using options with an average 9 days until expiry, is also relatively low. Its current 13.17 reading is well above February 14th’s 11.38, but it is still hardly pricing in much volatility over this busy period:
VIX9D, 1-Year, Daily Candles
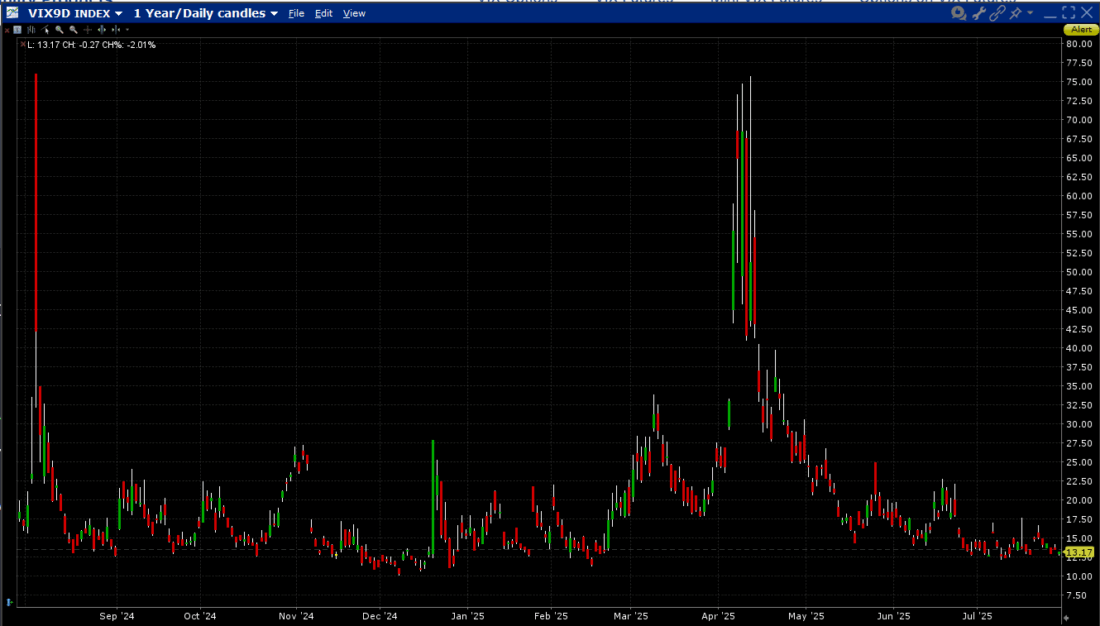
Source: Interactive Brokers
This is where it becomes important to look below the surface to try to understand the reasons why the options market might display such a blasé attitude toward the heavy news flow to come. There are a few possible reasons:
- It is typical for options traders to use historical volatility as the starting point for their expectations for future volatility. We’ve all heard that “past performance is no guarantee of future results”, but it is nonetheless a convenient basis for forward assumptions. Quite frankly, S&P 500 (SPX) historical volatility on both a 30-day and 10-day basis is quite low. Bear in mind that SPX has not had a > +/-1% close since it rose by 1.11% on June 24th – over a month ago. We can assert that VIX is actually pricing in a relatively high premium vis-à-vis recent history:
SPX (faint grey) with Implied Volatility (white), 10-day (yellow), and 30-day (orange) Historical Volatility
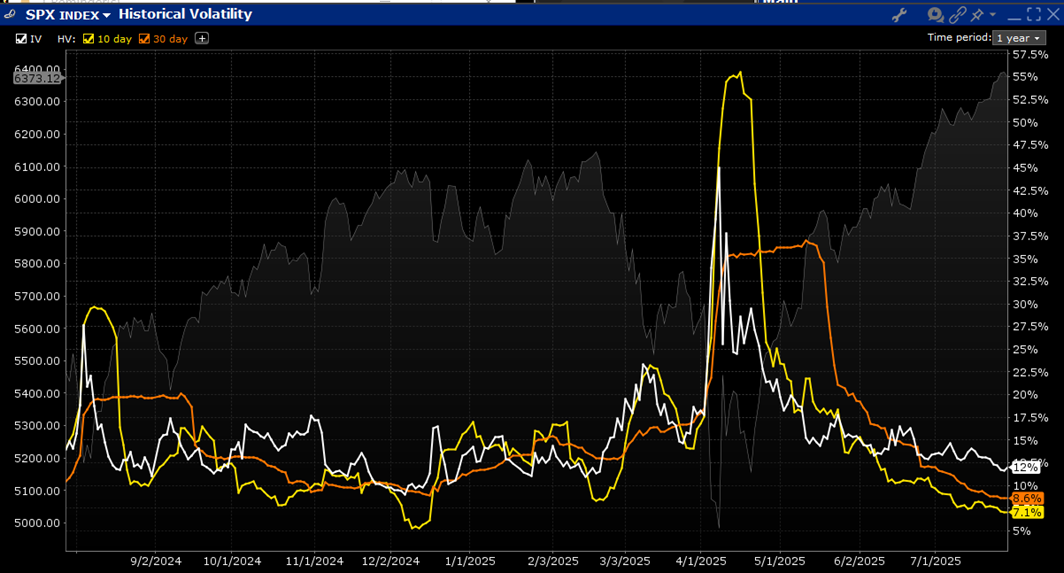
Source: Interactive Brokers
- Related to the prior point, we have frequently asserted that VIX represents the demand for hedging protection by institutions Just as there is little demand for umbrellas during a drought, there is little demand for hedging protection during a steadily rising market. We’ll know later this week if that is prudent or complacent.
- Correlations are quite low. We have previously discussed how the correlations between index components affect an index’ volatility. An index with all its stocks moving together, even in modest amounts, can display higher volatility than one with volatile components moving in opposite directions. Thus, if the similarly sized AAPL and AMZN each move 5% after earnings, but in opposite directions, the net index effect would be roughly nil. That is similar to what occurred last week when Tesla (TSLA) fell but had a muted index effect because the larger Alphabet (GOOG, GOOGL) rose, but by less than TSLA’s dip. The following chart, which we’ve used before, shows how correlations, as measured by the Cboe’s COR1M index, have been quite low. Perhaps there is a sign of concern that VIX is dropping more slowly than COR1M, something that presaged recent dips in SPX, but that is hardly conclusive.
1-Year Lines, VIX (red, right scale), COR1M (white, right), SPX (green, left)
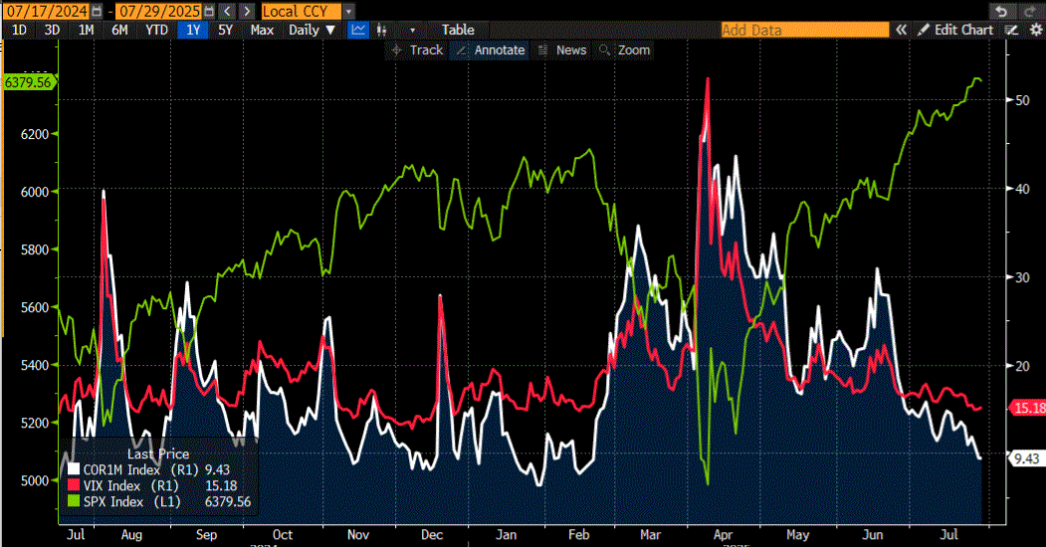
Source: Bloomberg
Join The Conversation
For specific platform feedback and suggestions, please submit it directly to our team using these instructions.
If you have an account-specific question or concern, please reach out to Client Services.
We encourage you to look through our FAQs before posting. Your question may already be covered!
Leave a Reply
Disclosure: Interactive Brokers
The analysis in this material is provided for information only and is not and should not be construed as an offer to sell or the solicitation of an offer to buy any security. To the extent that this material discusses general market activity, industry or sector trends or other broad-based economic or political conditions, it should not be construed as research or investment advice. To the extent that it includes references to specific securities, commodities, currencies, or other instruments, those references do not constitute a recommendation by IBKR to buy, sell or hold such investments. This material does not and is not intended to take into account the particular financial conditions, investment objectives or requirements of individual customers. Before acting on this material, you should consider whether it is suitable for your particular circumstances and, as necessary, seek professional advice.
The views and opinions expressed herein are those of the author and do not necessarily reflect the views of Interactive Brokers, its affiliates, or its employees.


Useful analysis and summaries of likely drivers