
- Solve real problems with our hands-on interface
- Progress from basic puts and calls to advanced strategies
Interactive Options Course

Posted July 17, 2025 at 9:27 am
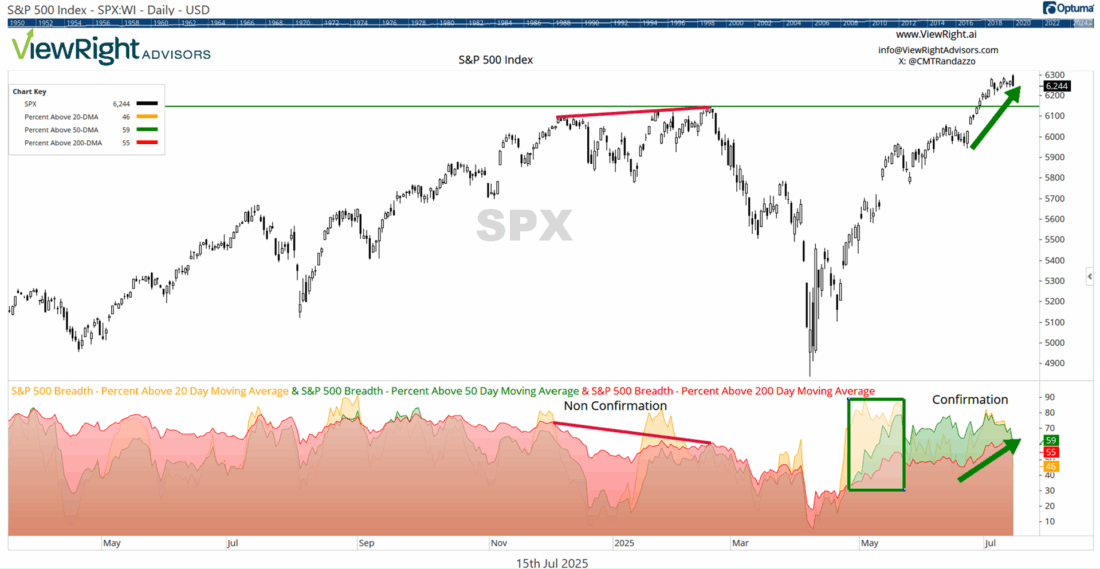
1/ Uptrend Participation Backs the Breakout
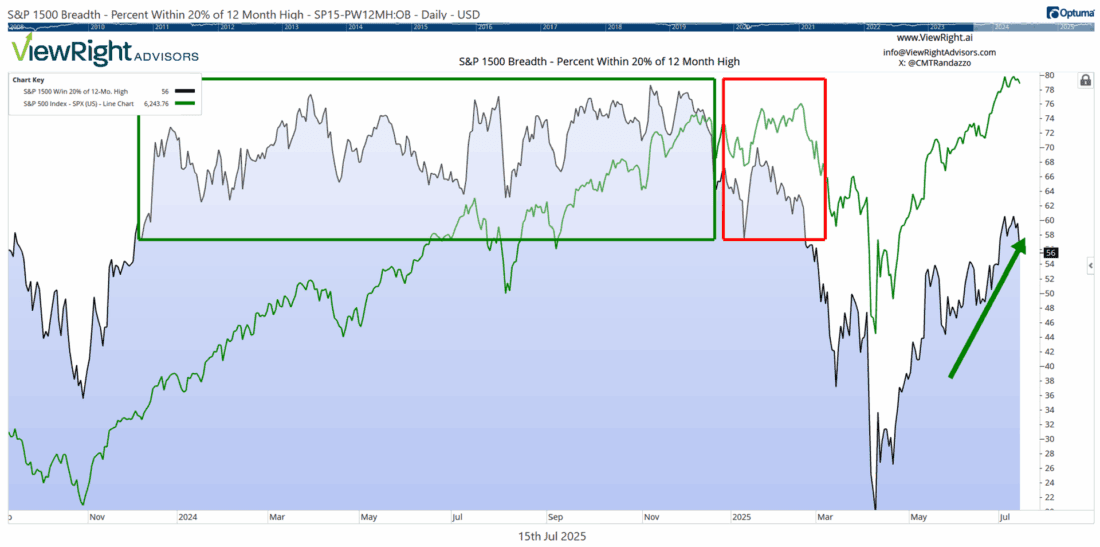
2/ Fewer Stocks in the Bear Zone
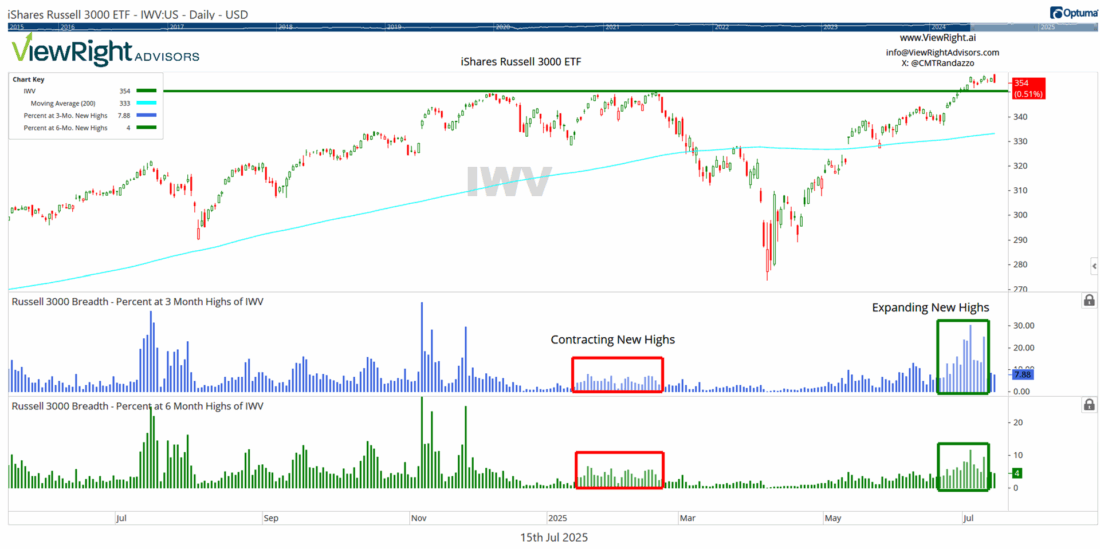
3/ New Highs, New Strength
Investopedia is partnering with CMT Association on this newsletter. The contents of this newsletter are for informational and educational purposes only, however, and do not constitute investing advice. The guest authors, which may sell research to investors, and may trade or hold positions in securities mentioned herein do not represent the views of CMT Association or Investopedia. Please consult a financial advisor for investment recommendations and services.
Uptrend Participation Backs the Breakout
Is the stock market’s rally still on solid footing—or starting to wobble under the surface? One reliable way to answer that question is by examining internal market breadth, or the various measures of the number of individual stocks participating in the advance. Recent data suggests the market is in better shape now than it was just a few months ago.
Take the S&P 500 Index (SPX), which reached a new all-time high in February 2025, but did so with limited support beneath the surface. As depicted in the accompanying chart, while the index price was rising, the percentage of S&P 500 members trading above their 50-day and 200-day moving averages (DMAs) was actually falling. In fact, these figures had been declining for several months by then. That negative divergence, shown in the chart’s bottom panel and labeled “non confirmation”, reflected narrowing participation—an early warning sign that fewer stocks were carrying more of the load. And since the major indexes are market-capitalization-weighted, major tops can often emerge without warning if one is not monitoring indicators like these.
Fast-forward to the latest round of highs, and the story looks more encouraging. Not only has the S&P 500 reclaimed and surpassed its February peak, but the underlying participation has improved. The percentage of stocks trading above their 20-, 50-, and 200-DMAs has moved higher alongside the index, and, perhaps more importantly, those breadth metrics are now trending upward rather than downward. Preceding this confirmation was a sustained surge in the percentage of S&P 500 stocks trading above their 20- and 50-DMAs past the 70% level. Such expansion in uptrend participation is evidence of enthusiastic demand and improved investor conviction.
That shift suggests a broader base of support behind the rally. Unlike in February, today’s highs are being confirmed by strengthening participation across timeframes, a sign of renewed health beneath the surface.
The takeaway: Market breadth has flipped from red flag to green light. The rally is no longer resting on the shoulders of a few mega-cap names; an expanding roster of contributors is carrying it. That transition gives the current advance a firmer footing—and enhances its potential staying power.
Fewer Stocks in the Bear Zone
At major market turning points, what’s happening beneath the surface often tells the real story. Earlier this year, the S&P 500 Index hit a new all-time high in February, but with a troubling undercurrent. A closer look at the broader market revealed a growing number of stocks were quietly slipping into deeper drawdowns, far from their own highs.
The chart we’re highlighting illustrates this relationship. Overlaid on the S&P 500’s price chart is the percentage of S&P 1500 stocks trading within 20% of their 12-month highs. The S&P 1500 combines the stocks in the S&P 500, S&P MidCap 400, and the S&P SmallCap 600 and is a broad measure of the U.S. equity market. The percentage of S&P 1500 stocks trading within 20% of their 12-month highs offers a practical lens into the market’s internal health: if fewer stocks are within that wide range of their highs, a growing number are down 20% or more—a classic definition of being in bear market territory.
As outlined in the red box on the chart below, this breadth metric weakened in the months leading up to the February high. Fewer stocks were holding up, and the overall structure of participation was deteriorating even as the headline index climbed. That negative divergence raised yellow flags about the durability of the advance, showing that, despite the new S&P 500 Index highs, a growing number of stocks in the broader market were already down more than 20%.
Contrast that to today. The S&P 500 is back at new highs—but this time, the internal backdrop is far healthier, though there’s still room for improvement. A rising percentage of S&P 1500 stocks are within 20% of their 12-month highs. Not only is the absolute level higher, but the trend is improving, signaling broader market strength beneath the surface. Fewer stocks are stuck in deep drawdowns, and more are participating in the rally.
Put simply, February’s new highs were driven by narrowing stock participation, while the current move is supported by expanding strength and evidence of retreating internal weakness. This shift doesn’t guarantee smooth sailing ahead, but it does lend greater credibility to the breakout. The next step is to get these figures into the green box, which represents between 55% and 80% of S&P 1500 stocks within 20% of their 12-month highs, as was the case between December 2023 and December 2024. In the last decade, other stints when this was true were between March 2016 and October 2018, February 2019 to February 2020, and November 2020 to January 2022.
The takeaway: Major indexes making new highs means little without broader participation behind them. Today’s rally stands on firmer ground than February’s, with improving breadth and fewer stocks stuck in deep drawdowns. While not yet ideal, the current backdrop reflects a healthier, more sustainable advance, with room for appreciable market gains if participation continues to expand.
New Highs, New Strength
Market breadth tells us not just where prices are, but how many stocks are coming along for the ride. That’s the key insight from a deeper look at the Russell 3000 Index, a comprehensive view of U.S. equities across large-, mid-, and small-cap stocks regardless of the exchange listing. Although the Russell 3000 Index is market-capitalization-weighted, using its constituents as the basis for a market breadth study is highly informative of the overall health of the market, given the large number of securities.
The chart below shows the Russell 3000 ETF (IWV) and features two key breadth indicators in histogram form: the percentage of Russell 3000 stocks making new 3-month highs (middle panel) and 6-month highs (bottom panel).
These measures help determine the extent to which rallies are being carried by expanding buying intensity. And, as with the other indicators covered in this update, that distinction was critical earlier this year. When the IWV hit a peak in late February, the percentage of constituent stocks making new 3- and 6-month highs had been steadily declining for months. This created a classic case of non-confirmation, where price made a new high, but the underlying participation didn’t support it—a red flag for potential weakness.
More recently, however, as IWV pushes back into new high territory, these measures of breadth are now expanding rather than contracting. Both the 3-month and 6-month high metrics are now rising to their highest levels since November 2024, reflecting that a greater number of stocks across sectors and market capitalizations are participating in the move.
This transition from weakening to strengthening breadth helps validate the breakout. It tells us that the advance is being propelled by greater conviction, providing the kind of “escape velocity” necessary for bull markets to flourish.
The takeaway: In February, price index gains were masking underlying internal fragility that was growing. Today, rising prices and broadening new 3- and 6-month highs are aligned, offering a more durable and convincing rally profile. While the short-term is always subject to noise, this expanding foundation increases the likelihood of further gains in the intermediate term.
—
Originally posted 17th July 2025
Investopedia.com: The comments, opinions and analyses expressed herein are for informational purposes only and should not be considered individual investment advice or recommendations to invest in any security or to adopt any investment strategy. While we believe the information provided herein is reliable, we do not warrant its accuracy or completeness. The views and strategies described on our content may not be suitable for all investors. Because market and economic conditions are subject to rapid change, all comments, opinions and analyses contained within our content are rendered as of the date of the posting and may change without notice. The material is not intended as a complete analysis of every material fact regarding any country, region, market, industry, investment or strategy. This information is intended for US residents only.
Information posted on IBKR Campus that is provided by third-parties does NOT constitute a recommendation that you should contract for the services of that third party. Third-party participants who contribute to IBKR Campus are independent of Interactive Brokers and Interactive Brokers does not make any representations or warranties concerning the services offered, their past or future performance, or the accuracy of the information provided by the third party. Past performance is no guarantee of future results.
This material is from Investopedia and is being posted with its permission. The views expressed in this material are solely those of the author and/or Investopedia and Interactive Brokers is not endorsing or recommending any investment or trading discussed in the material. This material is not and should not be construed as an offer to buy or sell any security. It should not be construed as research or investment advice or a recommendation to buy, sell or hold any security or commodity. This material does not and is not intended to take into account the particular financial conditions, investment objectives or requirements of individual customers. Before acting on this material, you should consider whether it is suitable for your particular circumstances and, as necessary, seek professional advice.
Any discussion or mention of an ETF is not to be construed as recommendation, promotion or solicitation. All investors should review and consider associated investment risks, charges and expenses of the investment company or fund prior to investing. Before acting on this material, you should consider whether it is suitable for your particular circumstances and, as necessary, seek professional advice.
Related Articles


Join The Conversation
For specific platform feedback and suggestions, please submit it directly to our team using these instructions.
If you have an account-specific question or concern, please reach out to Client Services.
We encourage you to look through our FAQs before posting. Your question may already be covered!