
- Solve real problems with our hands-on interface
- Progress from basic puts and calls to advanced strategies
Interactive Options Course

Posted July 11, 2025 at 10:00 am
Covered call strategies have become very popular among investors, particularly those looking for higher levels of yield. While covered call strategies can generate attractive levels of income under the right circumstances, traditional monthly strategies typically require investors to make a costly trade-off between high income potential and total return.
Some investors recognize and accept this trade-off in total return, believing that traditional monthly covered call strategies offer enhanced downside protection—but this expectation may be misplaced.
Over the past 10 years, the Cboe S&P 500 BuyWrite Index has captured 84% of the downside of the S&P 500, while only returning 65% of the upside.1 Any protection offered has been more than offset by missed long-term gains.
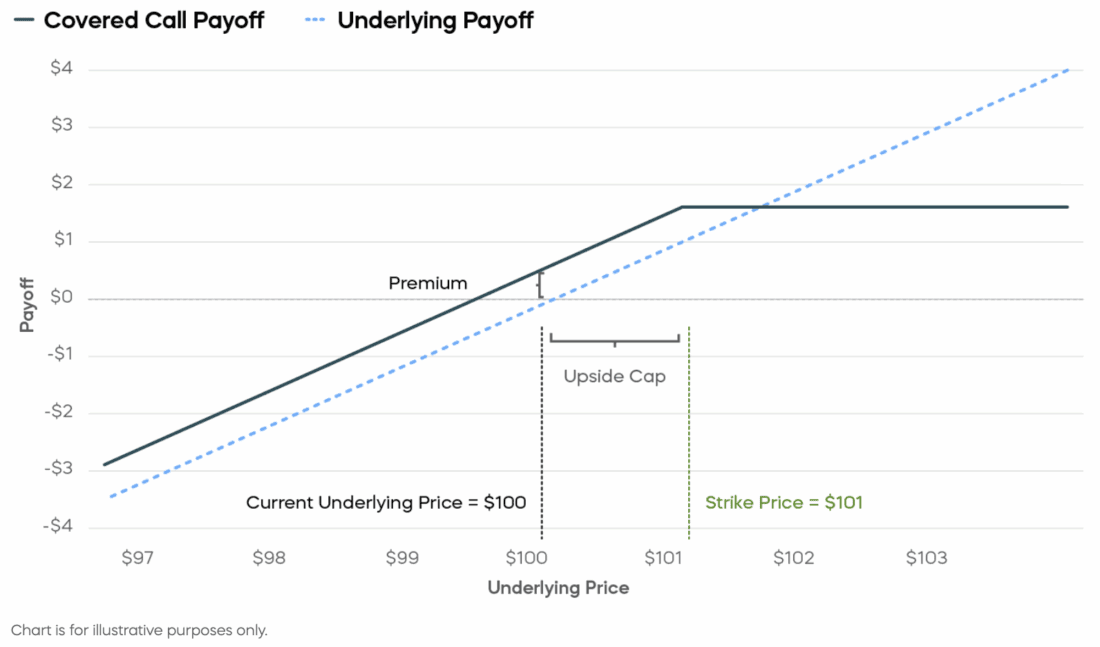
The trade-off of missed gains results from the payout structure of monthly covered call strategies, illustrated in the diagram below. An investor accepts a ceiling, or cap, on the appreciation of an investment—for example, a stock market index—in return for income from the sale of a call option. If the market price of the stock index rises above the strike price of the call option, the option is “in the money,” meaning the seller of the call option owes a payment to the buyer. This payout is equal to the difference between the price of the index and the option’s strike price. The option payout is “covered” by the gains on the stock index. The covered call strategy does not lose money if the price of the index rises above the option’s strike price, but neither can its return increase any further—the strategy simply caps the upside performance at that price.
In addition to illustrating the potentially significant upside trade-off, we can see from this diagram that traditional monthly covered call strategies do nothing structurally to eliminate much of the downside risk.
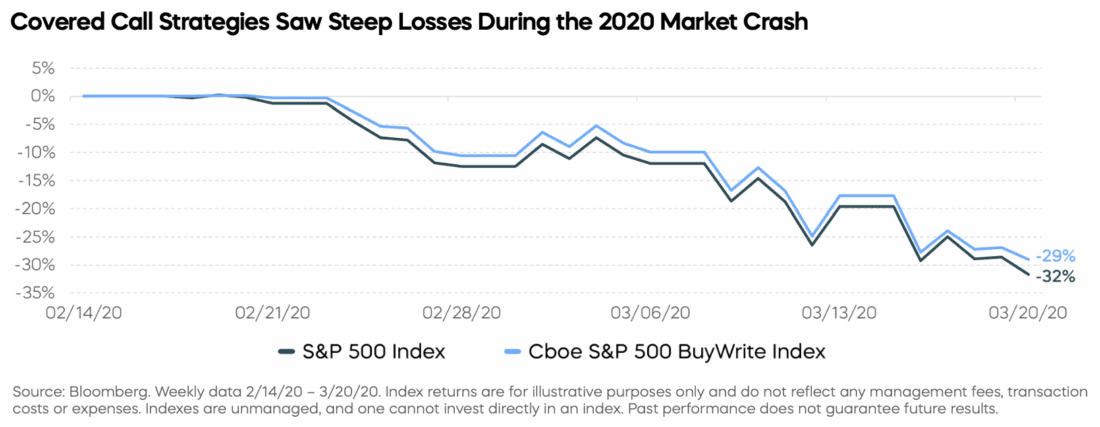
The stock market crash early in the COVID-19 pandemic provides an example of the lack of downside protection from monthly covered call strategies. The S&P 500 dropped roughly 32% from highs in February 2020 to a low point in March 2020. Investors in traditional covered call strategies expecting downside protection during that period would have been disappointed. The Cboe S&P 500 BuyWrite Index—a proxy for traditional monthly covered call strategies—declined by 29%, almost as much as the S&P 500.2
To make matters worse, when the S&P 500 recovered, investors only captured about half of the
market’s rebound later in the year.3
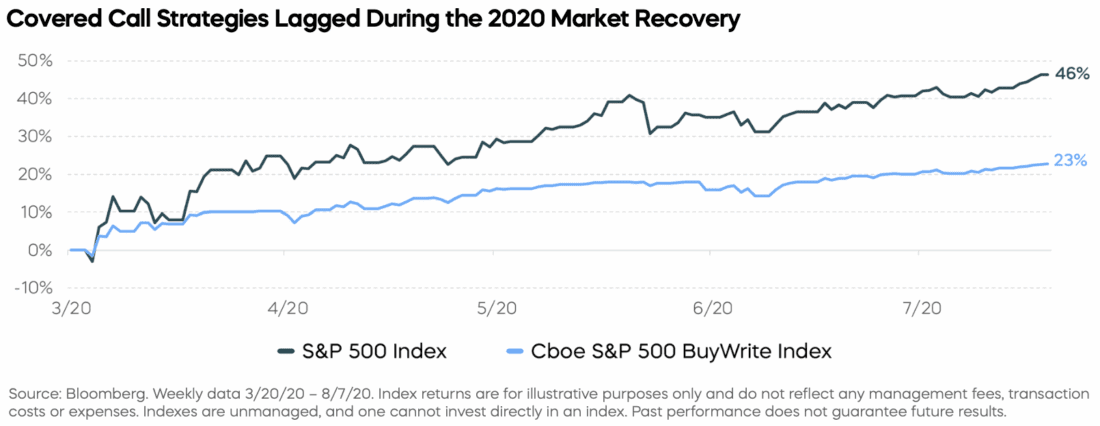
Over the entire period of the S&P 500’s drawdown and recovery, which brought the S&P 500 back to
even, an investor in a monthly covered call strategy like the Cboe S&P 500 BuyWrite Index would have
seen losses of approximately 13%.4
The COVID example is not an anomaly. Since the inception of the Cboe S&P 500 BuyWrite Index in April 2002, there have been six drawdowns of 10% or more from prior highs. During these periods, the Cboe S&P 500 BuyWrite Index captured nearly three quarters of the downside losses of the S&P 500 but returned just a bit more than half of the upside recovery on average.5
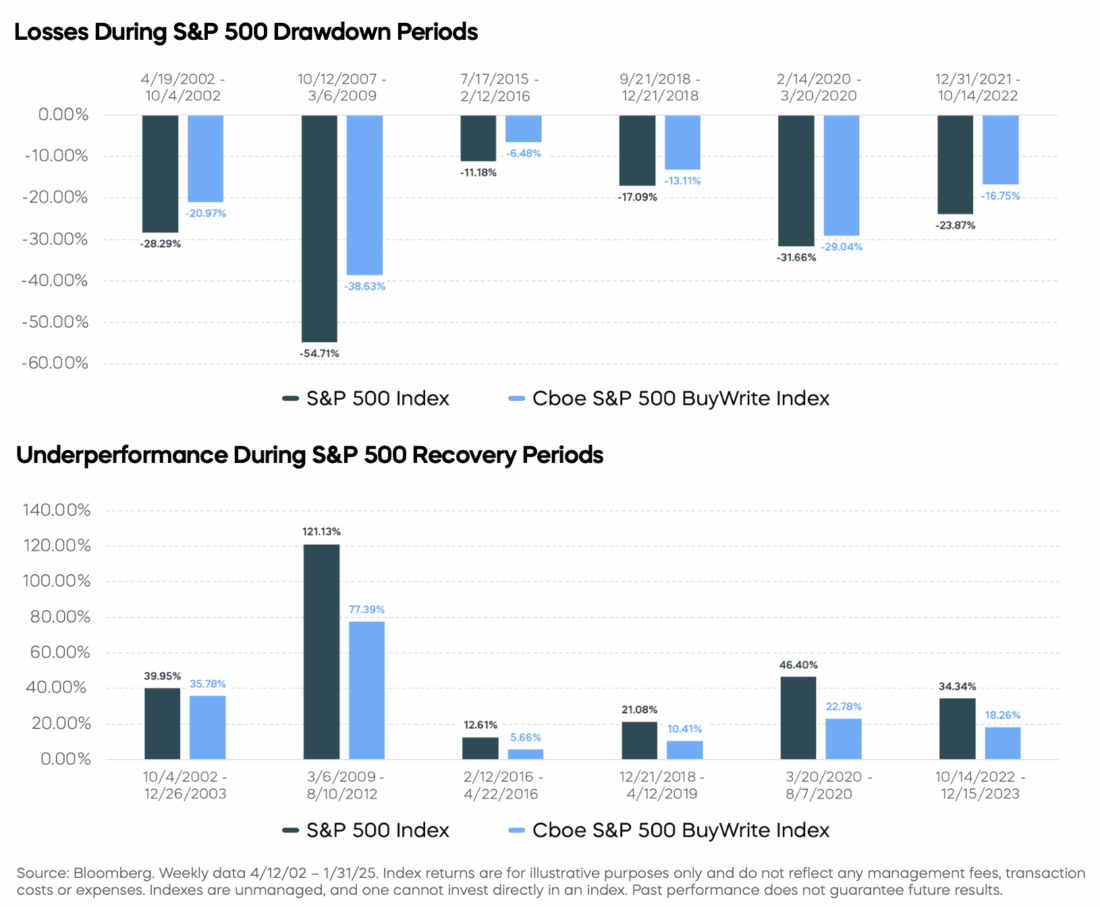
Clearly, traditional covered call solutions have neither provided enough downside protection during periods of equity market stress nor made up for it with their disappointing recoveries. This combination has led to traditional strategies significantly underperforming their benchmarks over time. Investors seeking downside protection can potentially do better with bonds. During the six equity drawdown periods noted earlier, bonds—as proxied by the ICE BofA 7-10 Year U.S. Treasury Bond Index—returned an average of 5.14%.
We provide a detailed analysis on how traditional covered call strategies have failed to provide meaningful diversification benefits, in our previous article, Balancing Yield & Total Return.
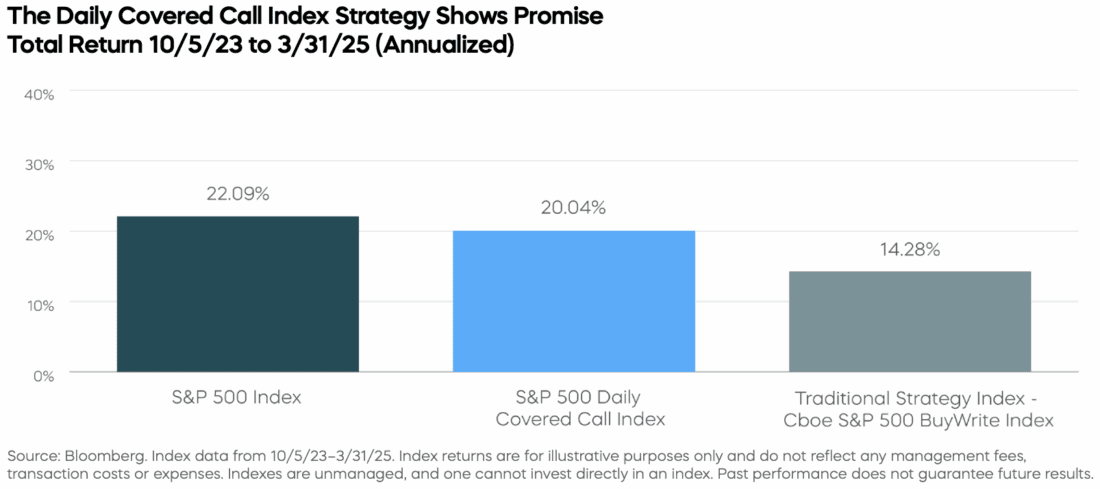
For investors looking for both income and long-term equity market returns in the same investment, there is a potentially better solution — a strategy designed to improve the high income vs. total return trade-off of monthly covered call strategies. This approach sells daily call options, resetting the upside cap every day and allowing for greater potential market participation.
While this strategy is relatively new—the S&P 500 Daily Covered Call Index was launched in October 2023—comparisons to traditional monthly strategies are compelling.6 In addition to its long-term total return, the income potential of a covered call strategy is key. The S&P 500 Daily Covered Call Index’s annualized yield as of March 31, 2025 was 11.9%. A covered call strategy’s daily option premium income will, of course, vary over time based on expectations of stock market volatility and other factors.7
Investors have turned to traditional monthly covered call strategies for income generation, equity market participation, and downside protection. While they may generate income, traditional strategies have sacrificed significant total returns and failed to diversify equity portfolios during periods of market drawdowns.
The new approach based on daily options is designed to target high income, provide an opportunity for greater upside equity market performance, and to potentially capture long-term returns that traditional covered call strategies sacrifice.
—
Originally Posted on July 2, 2025
Any forward-looking statements herein are based on expectations of ProShare Advisors LLC at the time. Whether or not actual results and developments will conform to ProShare Advisors LLC’s expectations and predictions, however, is subject to a number of risks and uncertainties, including general economic, market and business conditions; changes in laws or regulations or other actions made by governmental authorities or regulatory bodies; and other world economic and political developments. ProShare Advisors LLC undertakes no duty to update or revise any forward-looking statements, whether as a result of new information, future events or otherwise.
Investing involves risk, including the possible loss of principal. This information is not meant to be investment advice.
Information posted on IBKR Campus that is provided by third-parties does NOT constitute a recommendation that you should contract for the services of that third party. Third-party participants who contribute to IBKR Campus are independent of Interactive Brokers and Interactive Brokers does not make any representations or warranties concerning the services offered, their past or future performance, or the accuracy of the information provided by the third party. Past performance is no guarantee of future results.
This material is from ProShares and is being posted with its permission. The views expressed in this material are solely those of the author and/or ProShares and Interactive Brokers is not endorsing or recommending any investment or trading discussed in the material. This material is not and should not be construed as an offer to buy or sell any security. It should not be construed as research or investment advice or a recommendation to buy, sell or hold any security or commodity. This material does not and is not intended to take into account the particular financial conditions, investment objectives or requirements of individual customers. Before acting on this material, you should consider whether it is suitable for your particular circumstances and, as necessary, seek professional advice.
Options involve risk and are not suitable for all investors. For information on the uses and risks of options, you can obtain a copy of the Options Clearing Corporation risk disclosure document titled Characteristics and Risks of Standardized Options by going to the following link ibkr.com/occ. Multiple leg strategies, including spreads, will incur multiple transaction costs.
Any discussion or mention of an ETF is not to be construed as recommendation, promotion or solicitation. All investors should review and consider associated investment risks, charges and expenses of the investment company or fund prior to investing. Before acting on this material, you should consider whether it is suitable for your particular circumstances and, as necessary, seek professional advice.
Municipal Bonds are only available from Interactive Brokers for IBKR LLC, IBKR Canada, IBKR Hong Kong, IBKR Australia and IBKR Singapore entities.
Related Articles


Join The Conversation
For specific platform feedback and suggestions, please submit it directly to our team using these instructions.
If you have an account-specific question or concern, please reach out to Client Services.
We encourage you to look through our FAQs before posting. Your question may already be covered!