
- Solve real problems with our hands-on interface
- Progress from basic puts and calls to advanced strategies
Interactive Options Course
Posted July 8, 2025 at 9:11 am
1/ The Bullish Preferred Count
2/ The Bearish Alternate Counts
3/ Short-Term Pattern Considerations
4/ Long-Term Pattern Implications
Investopedia is partnering with CMT Association on this newsletter. The contents of this newsletter are for informational and educational purposes only, however, and do not constitute investing advice. The guest authors, which may sell research to investors, and may trade or hold positions in securities mentioned herein do not represent the views of CMT Association or Investopedia. Please consult a financial advisor for investment recommendations and services.
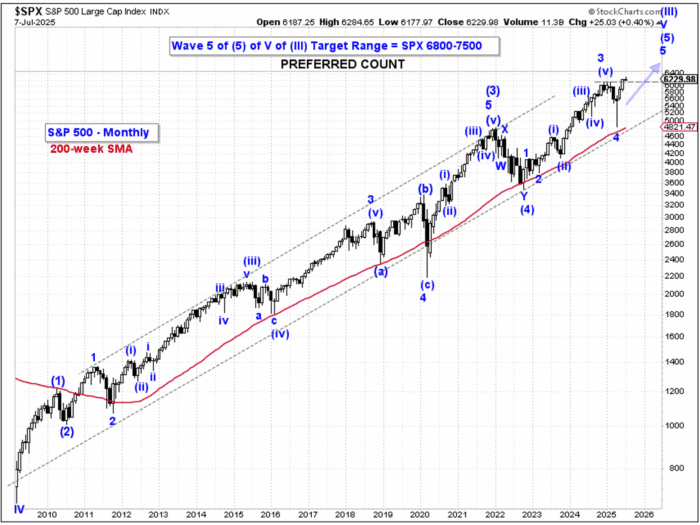
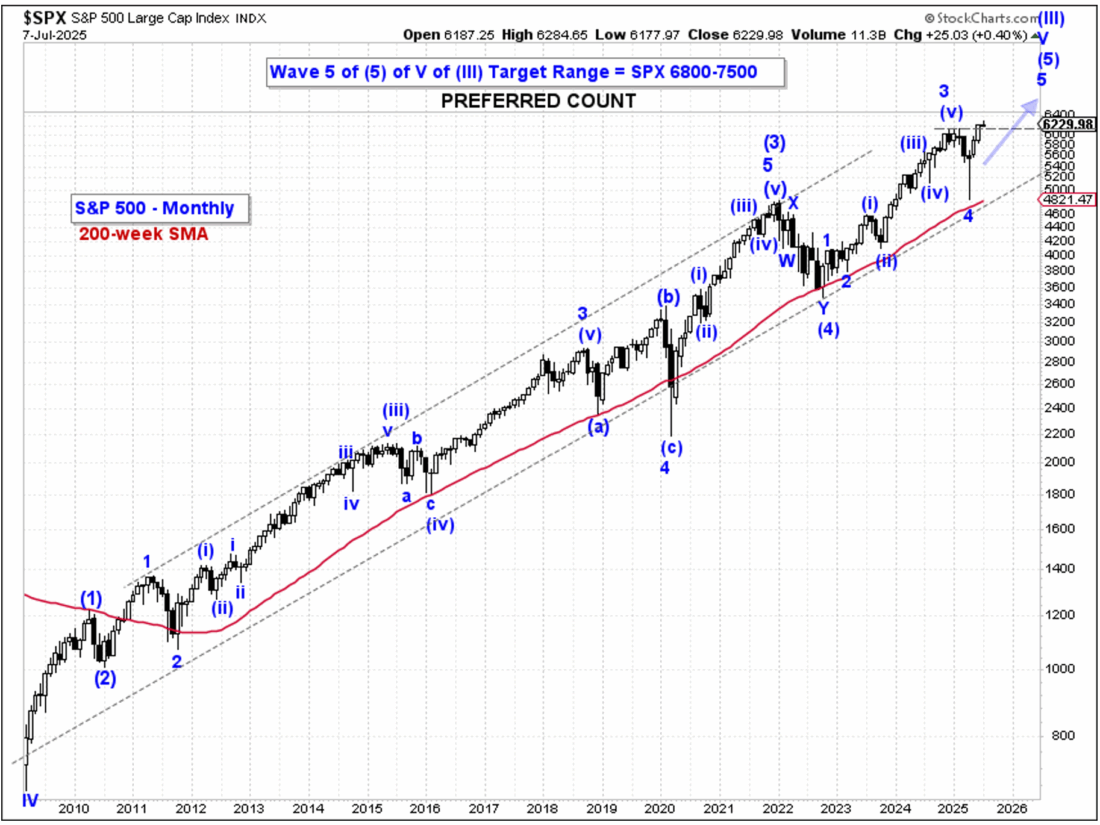
The Bullish Preferred Count
Our preferred Elliott Wave count presumes that the S&P 500 has only completed intermediate wave 3, of primary wave (5), of cycle wave V up. The most bullish interpretation is that intermediate wave 4 down bottomed on April 7th at SPX 4835. If correct, then intermediate wave 5 up is now in progress and has the potential to carry price into the SPX 6800-7500 range depending upon whether intermediate wave 5 traces out an impulse wave or and “ending diagonal” triangle.
The Bearish Alternate Counts
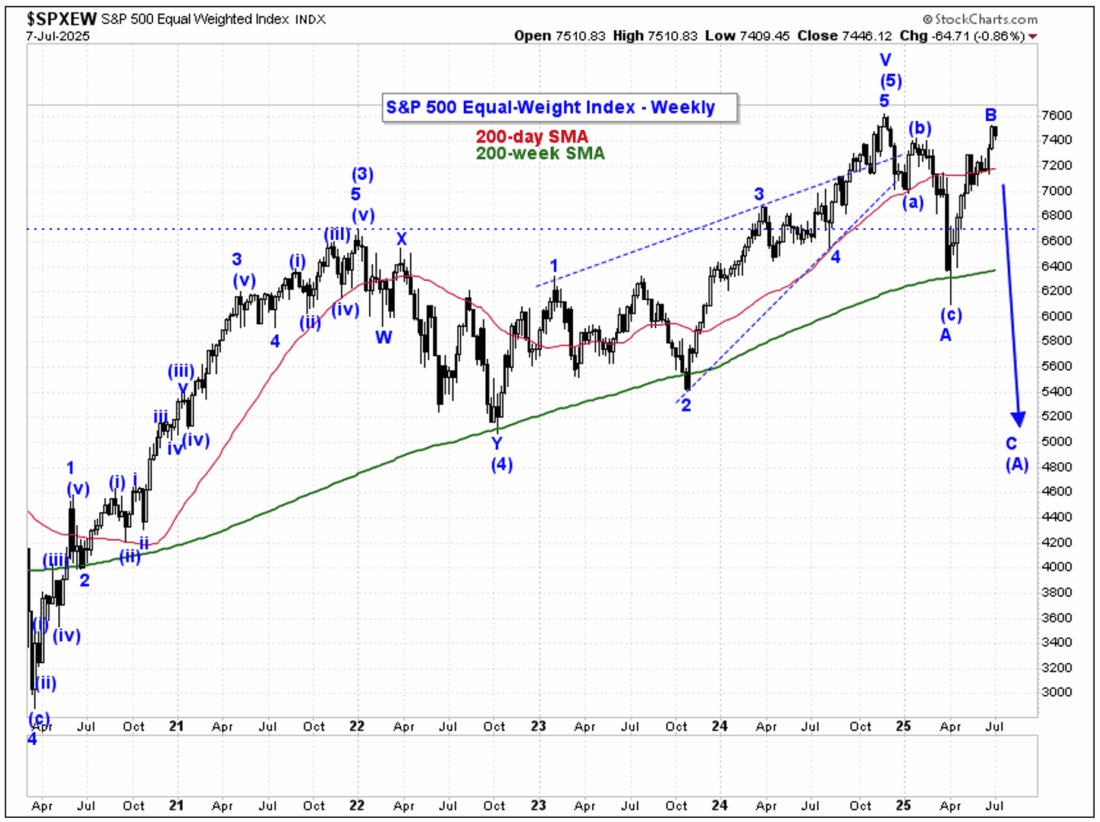
Our two top alternate Elliott Wave counts presume that the advance off the April 7th low of SPX 4835 is a countertrend move labeled as minor wave (b) up. If correct, then minor wave (b) could carry modestly higher into the SPX 6300 range, before minor wave (c) down ensues. Alternate I: A “symmetrical triangle” pattern. Under this rubric, minor waves (c), (d), and (e) would trace out a lateral corrective wave form making a series of higher lows and lower highs until the coil is complete. It will be followed by a thrust above the upper boundary of the pattern into intermediate wave 5 up. Some would say that this is a neutral scenario where the market simply corrects in time rather than by price.
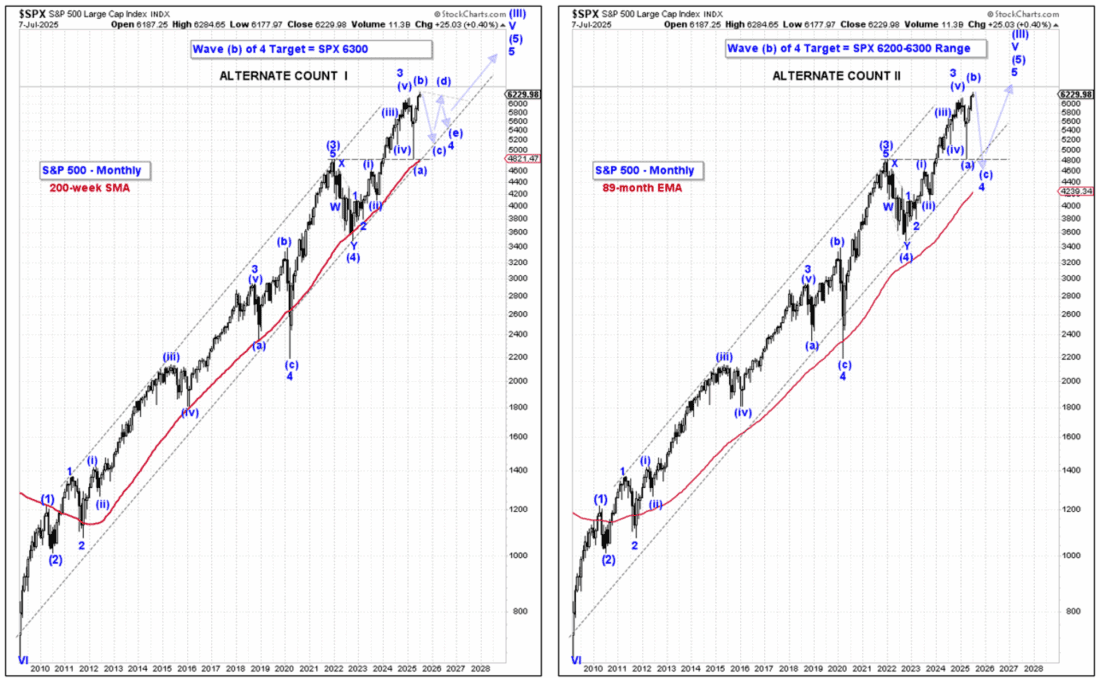
Alternate II: An “expanded flat” pattern. Under this rubric, minor wave (c) down would take the form of an impulse pattern. The decline would be aggressive and forceful — as if it were the third wave within an impulse pattern. The decline would then carry to new bear market lows surpassing the minor wave (a) low at SPX 4835. If this alternate proves correct, then minor wave (c) could be up to 1.618x the distance of minor wave (a) down — or about 2,122 handles. If today’s price action in the S&P 500 is indicating that minor wave (b) up has terminated, then a downside target of SPX 4150 would be reasonable. This is the second most bearish interpretation of the market’s price action. The most bearish interpretation would be that intermediate wave 5, of primary wave (5), of cycle wave V up has terminated. We’re not there yet in our analysis. But a sustained monthly close below the 200-week MA would get us there.
Short-Term Pattern Considerations
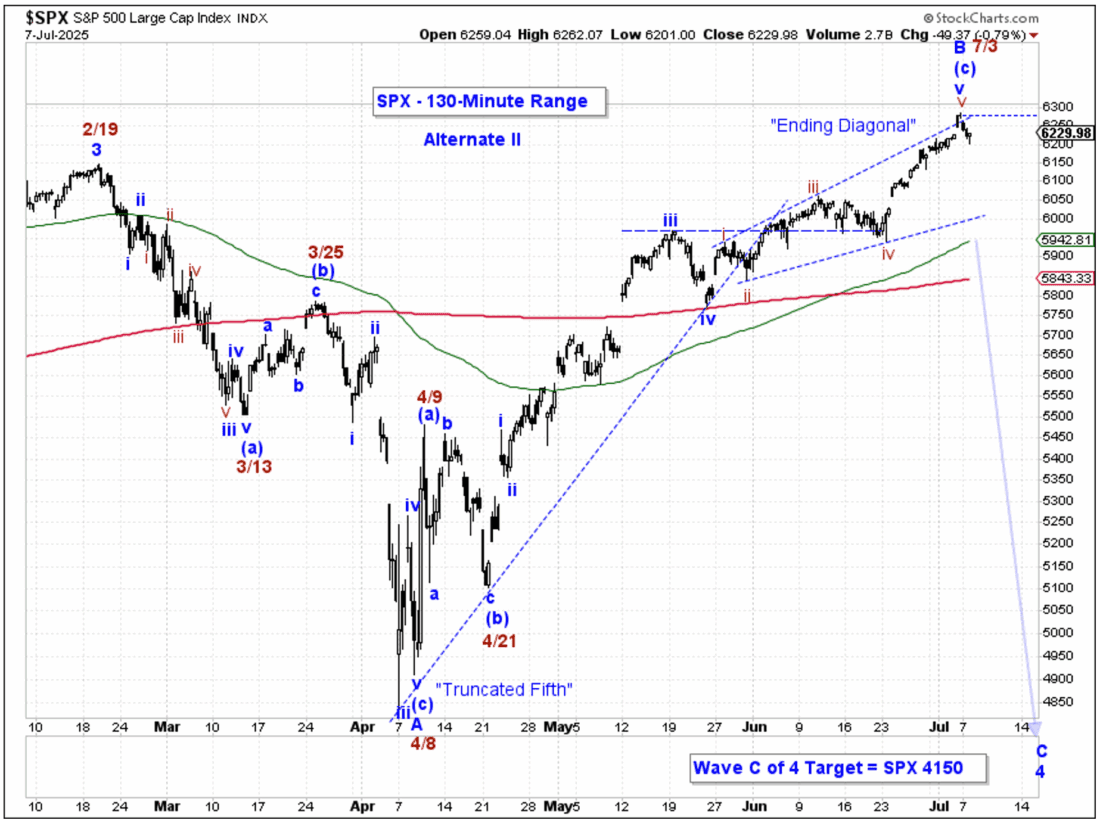
One reason not to dismiss the bearish alternate count is because the S&P 500 has been tracing out what appears to us to be an ending diagonal triangle of the “expanding” variety. If correct, this is a terminal pattern. Old school chartists might describe it as “three drives to a top.” This second alternate count actually aligns best with our preferred count for the S&P 500 Equal-Weight index, which so far has failed to post a new high, and appears poised to terminate intermediate wave B up. If this count is correct, then wave C will follow with an aggressive decline.
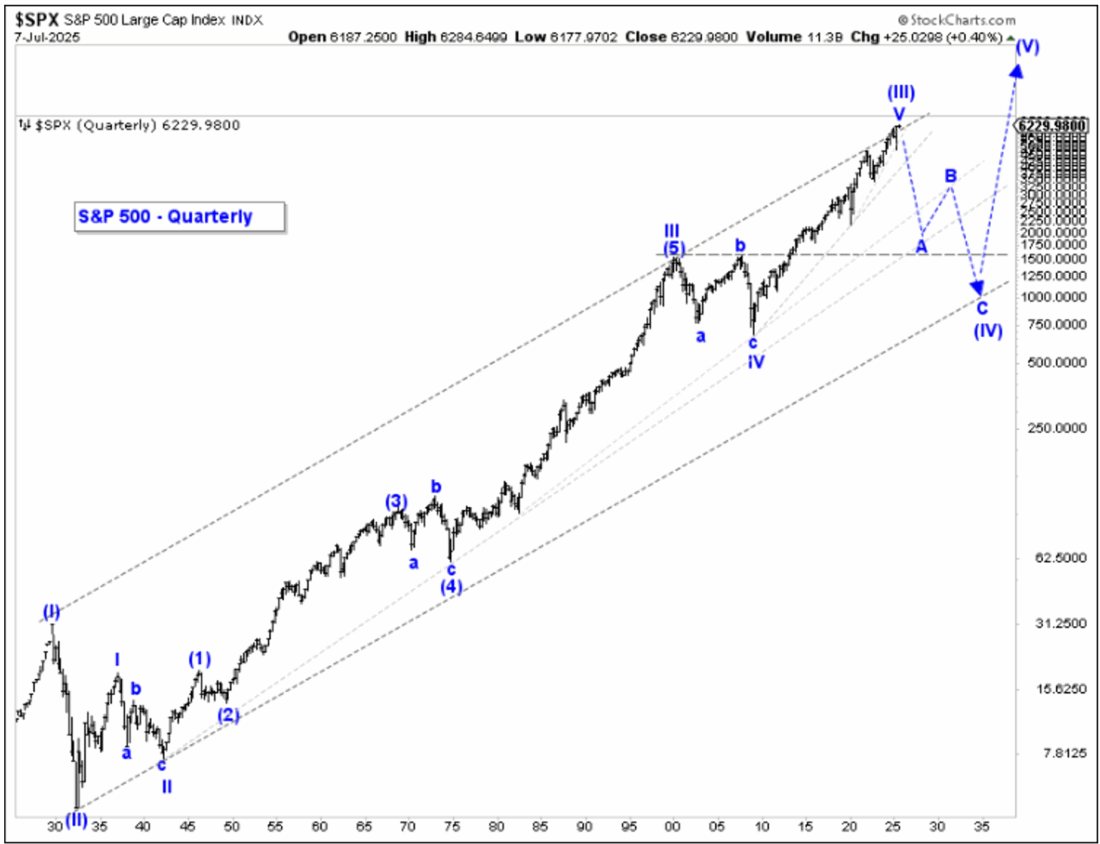
Long-Term Pattern Implications
Regardless of which, if any of these intermediate degree wave counts is correct, we must not lose sight of the bigger picture. There is a very high probability that our cycle wave V count is accurate. If so, then supercycle wave (III) is coming to its conclusion. When it terminates, whether now or six months from now, it won’t matter whether you caught that last 5%, 10%, or even 20% of the bull market’s upside potential. That’s because when supercycle wave (IV) down begins, the selling will be so swift and merciless you won’t know have time to react.
If you can’t bring yourself to take evasive action when the market is trading at SPX 6280, you won’t be able to pull the plug at SPX 6800 either. Why not? Because it’s human nature. You’ll want more. That SPX 7500 target is still out there, and you think that you’ll be able to outsmart the market and get out at the top. But you won’t. Remember what Nathan Rothschild said, “Fortunes are made by buying low and selling too soon.”
—
Originally posted 8th July 2025
Investopedia.com: The comments, opinions and analyses expressed herein are for informational purposes only and should not be considered individual investment advice or recommendations to invest in any security or to adopt any investment strategy. While we believe the information provided herein is reliable, we do not warrant its accuracy or completeness. The views and strategies described on our content may not be suitable for all investors. Because market and economic conditions are subject to rapid change, all comments, opinions and analyses contained within our content are rendered as of the date of the posting and may change without notice. The material is not intended as a complete analysis of every material fact regarding any country, region, market, industry, investment or strategy. This information is intended for US residents only.
Information posted on IBKR Campus that is provided by third-parties does NOT constitute a recommendation that you should contract for the services of that third party. Third-party participants who contribute to IBKR Campus are independent of Interactive Brokers and Interactive Brokers does not make any representations or warranties concerning the services offered, their past or future performance, or the accuracy of the information provided by the third party. Past performance is no guarantee of future results.
This material is from Investopedia and is being posted with its permission. The views expressed in this material are solely those of the author and/or Investopedia and Interactive Brokers is not endorsing or recommending any investment or trading discussed in the material. This material is not and should not be construed as an offer to buy or sell any security. It should not be construed as research or investment advice or a recommendation to buy, sell or hold any security or commodity. This material does not and is not intended to take into account the particular financial conditions, investment objectives or requirements of individual customers. Before acting on this material, you should consider whether it is suitable for your particular circumstances and, as necessary, seek professional advice.
Related Articles


Join The Conversation
For specific platform feedback and suggestions, please submit it directly to our team using these instructions.
If you have an account-specific question or concern, please reach out to Client Services.
We encourage you to look through our FAQs before posting. Your question may already be covered!