
- Solve real problems with our hands-on interface
- Progress from basic puts and calls to advanced strategies
Interactive Options Course
Posted July 7, 2025 at 9:17 am
From SIA Charts
1/ Fabrinet (FN)
2/ Candlestick Chart
3/ Point and Figure Chart
Investopedia is partnering with CMT Association on this newsletter. The contents of this newsletter are for informational and educational purposes only, however, and do not constitute investing advice. The guest authors, which may sell research to investors, and may trade or hold positions in securities mentioned herein do not represent the views of CMT Association or Investopedia. Please consult a financial advisor for investment recommendations and services.
Fabrinet (FN)
Fabrinet is a global manufacturing services provider specializing in precision optical, electro-mechanical, and electronic products, serving industries such as optical communications, medical devices, automotive, and aerospace. Known for its expertise in high-mix, low-volume production and complex product assembly, the company offers advanced engineering, prototyping, and supply chain solutions. Fabrinet’s head office is located in Thailand, where its main manufacturing operations are also based. It supports customers worldwide with additional facilities in the U.S., China, and Israel.
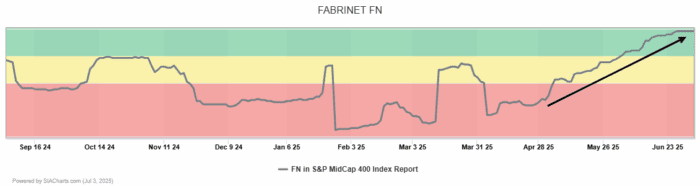
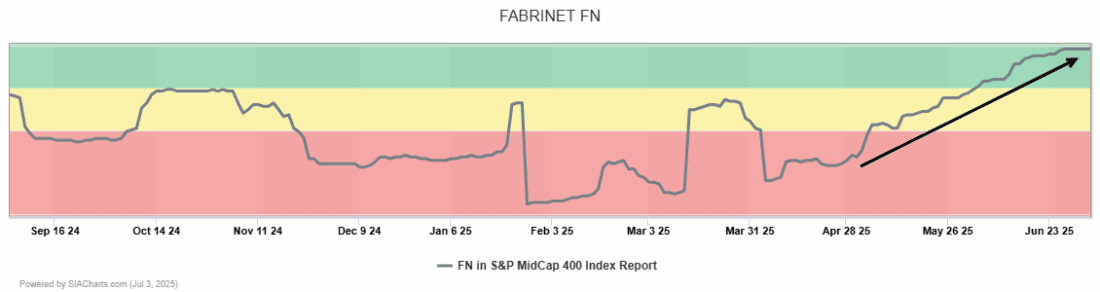
Shares of Fabrinet have moved into the Favored zone of the SIA MidCap 400 Index Report after previously being buried in the Unfavored red zone. This march into the Favored zone comes on the heels of a year-to-date performance of 34.01 percent and a 70.76 percent quarterly gain. As a result, shares of FN have climbed 313 spots on the SIA S&P 400 Index Report over the past quarter, now sitting at position 12 within the Favored zone.
Candlestick Chart
The attached candlestick chart illustrates this uptrend clearly, showing that shares have broken through two levels of resistance, now support, at 240 dollars and 270 dollars, and have been trending steadily along the black uptrend line, although the stock has surged above it in the past month. Also notable is the perfect SMAX score of 10 out of 10, which further underscores the stock’s strong relative strength, this time compared to a basket of other asset classes including cash, bonds, currencies, commodities, and other equities.

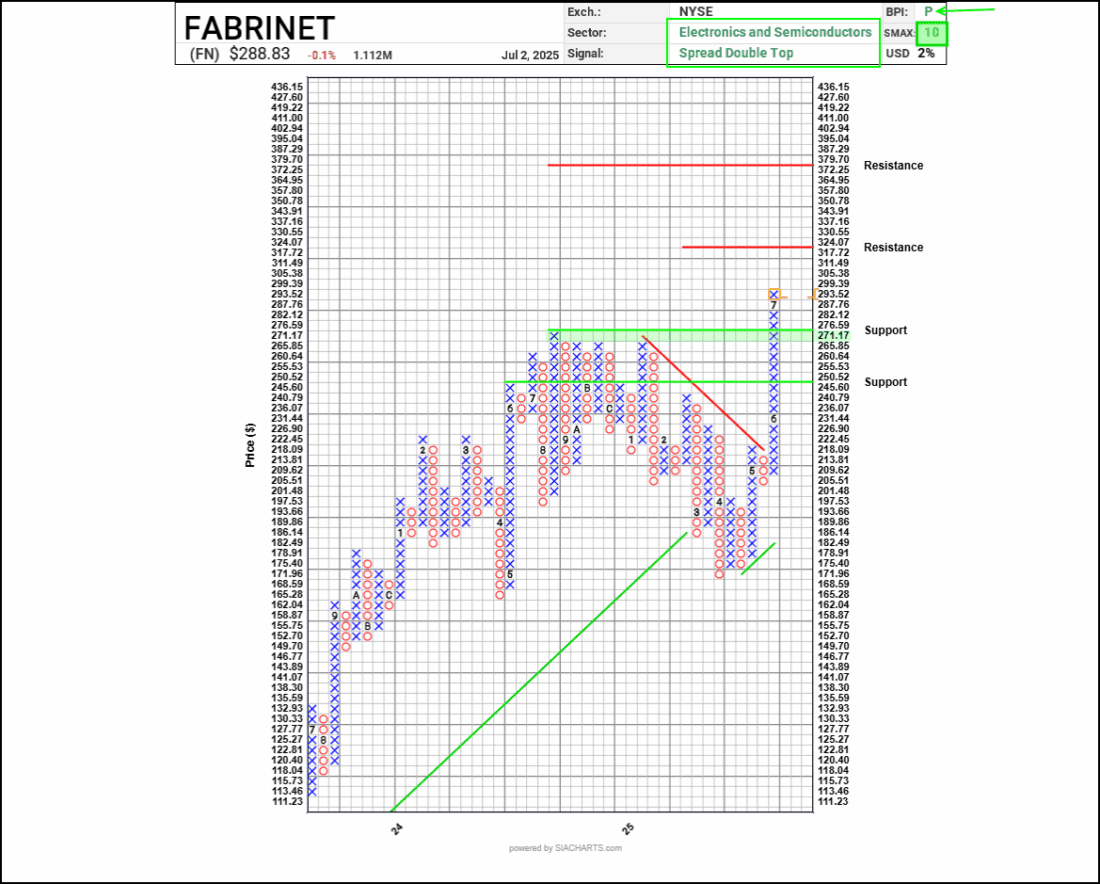
Point and Figure Chart
Turning next to the point and figure chart, we see this powerful move reflected in a column of X’s over the past two months, with shares pushing higher through former resistance, now support, at $245.60 dollars and then $271.17 dollars. Using point and figure vertical count analysis, SIA practitioners might identify potential resistance at $324.07 dollars and possibly higher at $379.70 dollars, based on prior consolidation levels. The latest point and figure signal is a spread double top, which has propelled the stock to new highs. This is especially notable in a market where many indexes appear to be brushing up against resistance, once again highlighting Fabrinet’s relative strength.
—
Originally posted 4th July 2025
Investopedia.com: The comments, opinions and analyses expressed herein are for informational purposes only and should not be considered individual investment advice or recommendations to invest in any security or to adopt any investment strategy. While we believe the information provided herein is reliable, we do not warrant its accuracy or completeness. The views and strategies described on our content may not be suitable for all investors. Because market and economic conditions are subject to rapid change, all comments, opinions and analyses contained within our content are rendered as of the date of the posting and may change without notice. The material is not intended as a complete analysis of every material fact regarding any country, region, market, industry, investment or strategy. This information is intended for US residents only.
Information posted on IBKR Campus that is provided by third-parties does NOT constitute a recommendation that you should contract for the services of that third party. Third-party participants who contribute to IBKR Campus are independent of Interactive Brokers and Interactive Brokers does not make any representations or warranties concerning the services offered, their past or future performance, or the accuracy of the information provided by the third party. Past performance is no guarantee of future results.
This material is from Investopedia and is being posted with its permission. The views expressed in this material are solely those of the author and/or Investopedia and Interactive Brokers is not endorsing or recommending any investment or trading discussed in the material. This material is not and should not be construed as an offer to buy or sell any security. It should not be construed as research or investment advice or a recommendation to buy, sell or hold any security or commodity. This material does not and is not intended to take into account the particular financial conditions, investment objectives or requirements of individual customers. Before acting on this material, you should consider whether it is suitable for your particular circumstances and, as necessary, seek professional advice.
Related Articles


Join The Conversation
For specific platform feedback and suggestions, please submit it directly to our team using these instructions.
If you have an account-specific question or concern, please reach out to Client Services.
We encourage you to look through our FAQs before posting. Your question may already be covered!