
- Solve real problems with our hands-on interface
- Progress from basic puts and calls to advanced strategies
Interactive Options Course
Posted July 2, 2025 at 10:24 am
1/ KOSPI Index
2/ NASDAQ on the Move
3/ IBEX leads Europe
Investopedia is partnering with CMT Association on this newsletter. The contents of this newsletter are for informational and educational purposes only, however, and do not constitute investing advice. The guest authors, which may sell research to investors, and may trade or hold positions in securities mentioned herein do not represent the views of CMT Association or Investopedia. Please consult a financial advisor for investment recommendations and services
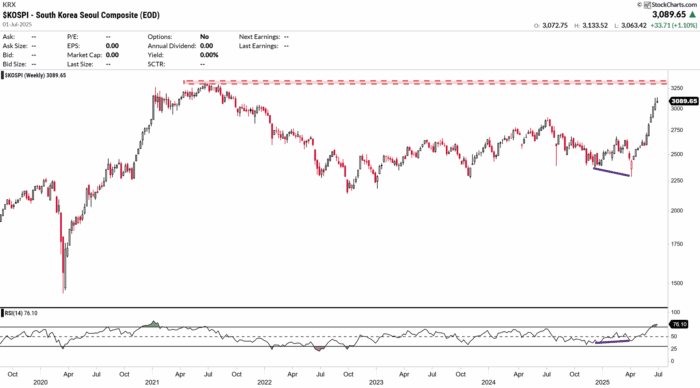
KOSPI Index: Approaching Resistance Amid Strong Uptrend
The KOSPI index has shown a significant upward trend since its 2020 lows, reaching 3,089.65 as of July 1, 2025—up 1.12% (+33.71 points) in the latest session. However, the index is nearing a key resistance level at 3,100, marked by the red dotted line.
The index previously underwent 61.80% and 50.00% retracements from earlier peaks, but the uptrend resumed in 2024 within a rising channel (purple line), suggesting continued strength. The breakout above the 3,000 level in 2025 signals bullish m
The KOSPI’s strength aligns with South Korea’s accommodative monetary policy and the global weakness in the U.S. dollar (USD at 97.21), which supports South Korean exports—particularly in the technology sector.
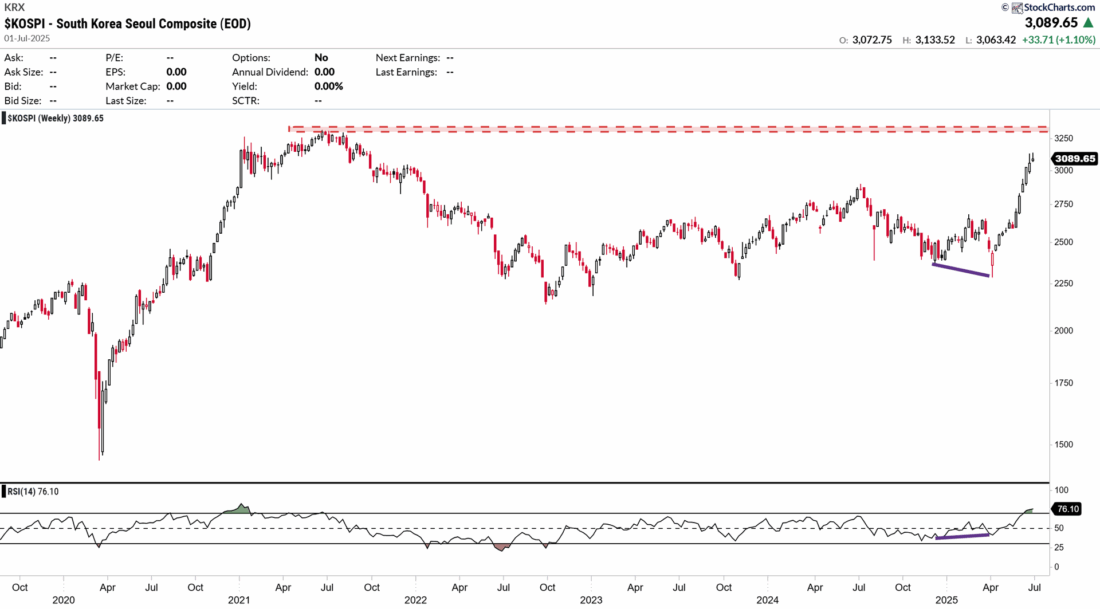
The 5-week RRG chart ending July 1, 2025, shows the relative rotation of various global indices based on JdK RS-Ratio and RS-Momentum. The KOSPI ($KOSPI) is positioned in the “Leading” quadrant with an RS-Ratio around 104 and positive RS-Momentum, indicating it is outperforming other indices such as the Dow Jones ($DJW), currently at 689.41.
The KOSPI’s transition from the “Improving” quadrant to “Leading” reflects growing momentum, supported by its rising RS-Momentum, making it a key indicator for investors seeking bullish opportunities in emerging markets.
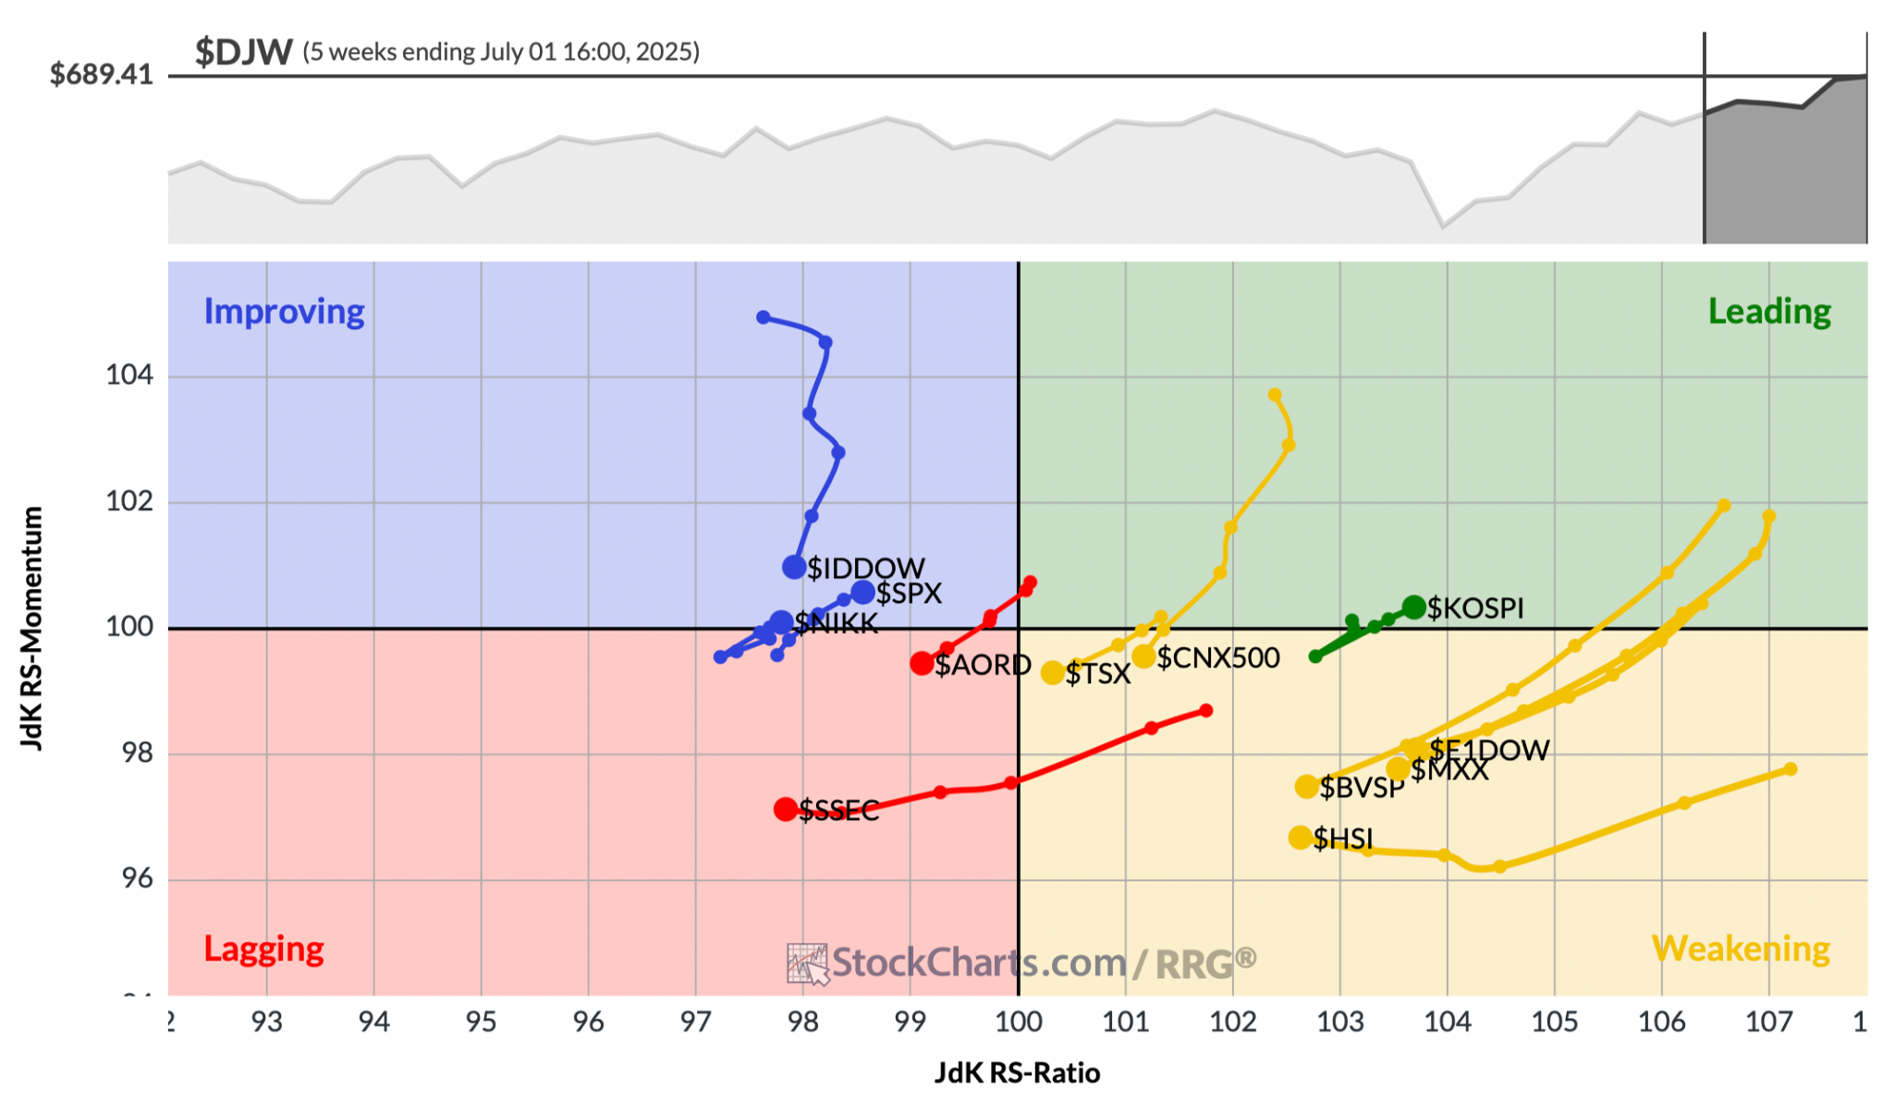
NASDAQ on the Move
The Nasdaq hit new highs, propelled by the “magnificent seven” tech giants reaching a combined $10 trillion market cap, dominating market conversations.
Key Levels:
Macroeconomic Context
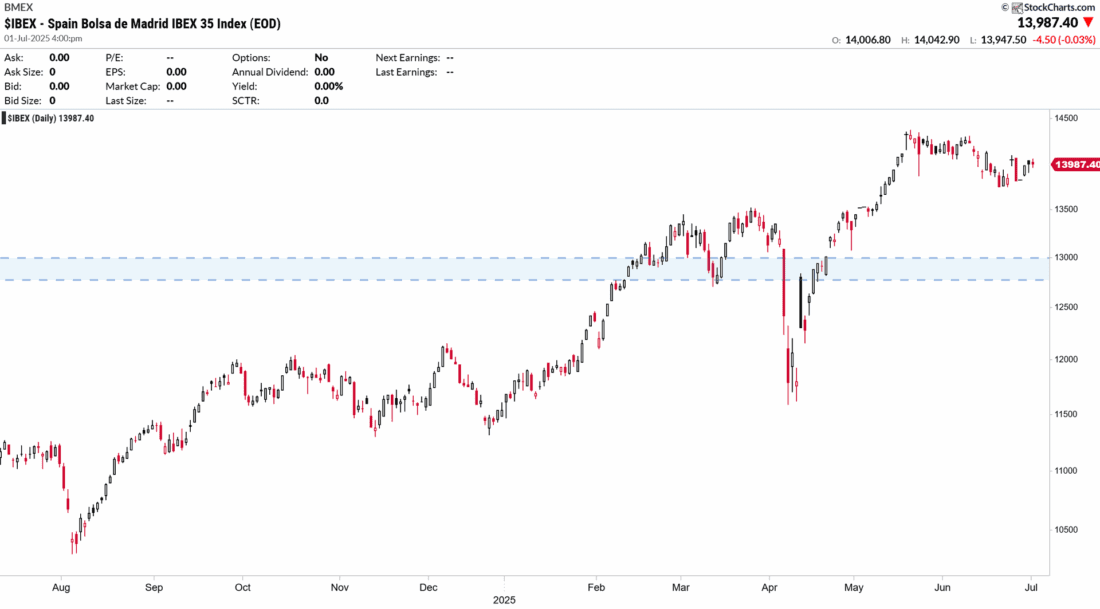
IBEX leads Europe
Closing near 14,000 points, the Ibex 35 gained attention with Indra leading gains and banks showing resilience, reflecting a rebound from recent volatility influenced by trade policies.
The index has been bouncing within a wide range since the 2000s, with a failed breakout in 2007 where it was unable to move beyond the 15,000 level. Recently, the index has broken through this resistance once again, drawing attention as investors watch to see whether it can sustain the move and reach higher levels this time.
Macroeconomic Context
Relevance
—
Originally posted 2nd July 2025
Investopedia.com: The comments, opinions and analyses expressed herein are for informational purposes only and should not be considered individual investment advice or recommendations to invest in any security or to adopt any investment strategy. While we believe the information provided herein is reliable, we do not warrant its accuracy or completeness. The views and strategies described on our content may not be suitable for all investors. Because market and economic conditions are subject to rapid change, all comments, opinions and analyses contained within our content are rendered as of the date of the posting and may change without notice. The material is not intended as a complete analysis of every material fact regarding any country, region, market, industry, investment or strategy. This information is intended for US residents only.
Information posted on IBKR Campus that is provided by third-parties does NOT constitute a recommendation that you should contract for the services of that third party. Third-party participants who contribute to IBKR Campus are independent of Interactive Brokers and Interactive Brokers does not make any representations or warranties concerning the services offered, their past or future performance, or the accuracy of the information provided by the third party. Past performance is no guarantee of future results.
This material is from Investopedia and is being posted with its permission. The views expressed in this material are solely those of the author and/or Investopedia and Interactive Brokers is not endorsing or recommending any investment or trading discussed in the material. This material is not and should not be construed as an offer to buy or sell any security. It should not be construed as research or investment advice or a recommendation to buy, sell or hold any security or commodity. This material does not and is not intended to take into account the particular financial conditions, investment objectives or requirements of individual customers. Before acting on this material, you should consider whether it is suitable for your particular circumstances and, as necessary, seek professional advice.
Related Articles

: How to Scale Trades")
 Client Portal – Trading and Advanced Functions (Cantonese)")


Join The Conversation
For specific platform feedback and suggestions, please submit it directly to our team using these instructions.
If you have an account-specific question or concern, please reach out to Client Services.
We encourage you to look through our FAQs before posting. Your question may already be covered!