
- Solve real problems with our hands-on interface
- Progress from basic puts and calls to advanced strategies
Interactive Options Course

Posted June 26, 2025 at 10:36 am
The article “Are Discount Rates More Important than Future Earnings for Stock Valuation?” was originally posted on Alpha Architect blog.
A longstanding belief in investing is that price ratios like P/E and P/B reflect expectations for future growth. But this new research turns that idea on its head. This analysis finds that most of the variation in price ratios across stocks is not about future earnings—it’s about differences in expected returns. In fact, over 75% of the cross-sectional variation in P/E ratios is driven by future return differences, not growth expectations. This challenges many common asset pricing models and changes how investors should think about value, growth, and long-term return forecasting.
Expected Returns, Not Growth, Drive Valuation Differences
Contrary to the belief that high valuations signal high growth, the paper shows that P/E ratios mostly reflect lower expected returns, not higher future earnings growth. This applies to both individual stocks and growth/value portfolios.
Price Ratios Misinterpreted in Models
Classic asset pricing models often attribute valuation differences to growth expectations. However, most of these models can’t explain the magnitude of return dominance found in the data. Models assuming persistent risk exposure or slow-learning mispricing better fit the evidence. This reinforces what Alpha Architect describes about the importance of understanding valuation signals in terms of profitability and quality—not just presumed growth.
Price-to-Book’s Predictive Power Comes from Today’s Profitability
The study reconciles earlier research suggesting P/B ratios predict profitability by showing that P/B is strongly related to current earnings-book ratios—not future earnings growth.
Look Deeper Than Price Ratios
High P/E or P/B ratios don’t necessarily signal high-growth companies. Instead, they often mean the market is demanding lower returns. Advisors should help clients understand that what looks like “quality growth” may just be expensive and low-return.
Rethink Growth Stock Exposure in Long-Term Portfolios
Since growth stocks with high price ratios tend to deliver lower long-term returns, portfolios tilted too heavily toward these may underperform over time—especially in environments where valuation compression matters.
Build Models that Align with Real Return Drivers
Investment strategies and screens should shift toward identifying persistent return-related features (like earnings yield, profitability, or mispricing signals), rather than just using price multiples as crude growth proxies. It echoes this article about the quality factor, which explains how factors like quality and profitability provide more reliable information than price ratios alone.
“You may have heard that when a stock has a high P/E ratio, it means the company is expected to grow fast. But new research shows that’s not the full picture. In fact, these high prices often mean the stock is expected to deliver lower returns going forward—not necessarily that it will grow faster. That’s why we take valuation signals carefully and combine them with other indicators to guide your long-term strategy.”
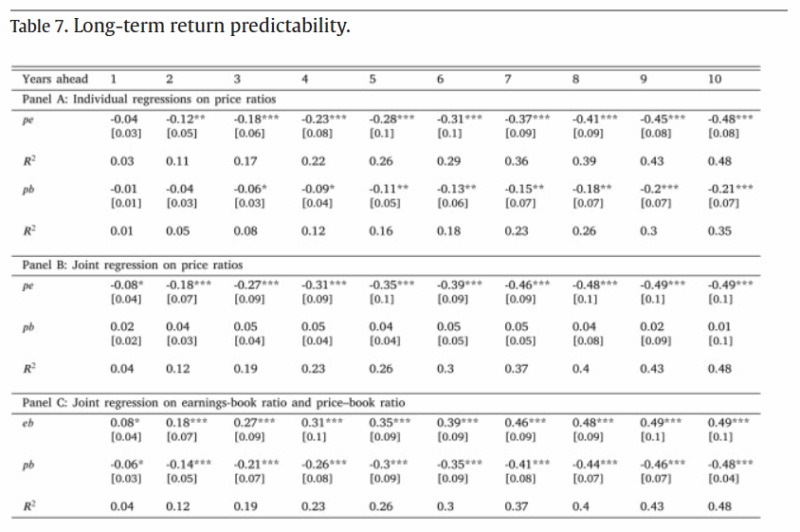
The table below shows the results for the price–earnings ratio and the price–book ratio. Panel A shows separate univariate regressions of future returns on the price–earnings ratio and the price–book ratio. At every horizon, we see find that the price–earnings ratio predicts future returns with a larger magnitude coefficient and a higher R2 than the price–book ratio. As shown in the final column of Panel A, nearly half (47.6%) of all variation in ten-year returns is explained by the price–earnings ratio.
The results are hypothetical results and are NOT an indicator of future results and do NOT represent returns that any investor actually attained. Indexes are unmanaged and do not reflect management or trading fees, and one cannot invest directly in an index.
What explains cross-sectional dispersion in stock valuation ratios? We find that 75% of dispersion in price-earnings ratios is reflected in differences in future returns, while only 25% is reflected in differences in future earnings growth. This holds at both the portfolio-level and the firm-level. We reconcile these conclusions with previous literature which has found a strong relation between prices and future profitability. Our results support models in which the cross-section of price-earnings ratios is driven mainly by discount rates or mispricing rather than future earnings growth. Evaluating six models of the value premium, we find that most models struggle to match our results, however, models with long-lived differences in risk exposure or gradual learning about parameters perform the best. The lack of earnings growth differences at long horizons provides new evidence in favor of long-run return predictability. We also show a similar dominance of predicted returns for explaining the dispersion in return surprises.
The views and opinions expressed herein are those of the author and do not necessarily reflect the views of Alpha Architect, its affiliates or its employees. Our full disclosures are available here. Definitions of common statistics used in our analysis are available here (towards the bottom).
This site provides NO information on our value ETFs or our momentum ETFs. Please refer to this site.
Information posted on IBKR Campus that is provided by third-parties does NOT constitute a recommendation that you should contract for the services of that third party. Third-party participants who contribute to IBKR Campus are independent of Interactive Brokers and Interactive Brokers does not make any representations or warranties concerning the services offered, their past or future performance, or the accuracy of the information provided by the third party. Past performance is no guarantee of future results.
This material is from Alpha Architect and is being posted with its permission. The views expressed in this material are solely those of the author and/or Alpha Architect and Interactive Brokers is not endorsing or recommending any investment or trading discussed in the material. This material is not and should not be construed as an offer to buy or sell any security. It should not be construed as research or investment advice or a recommendation to buy, sell or hold any security or commodity. This material does not and is not intended to take into account the particular financial conditions, investment objectives or requirements of individual customers. Before acting on this material, you should consider whether it is suitable for your particular circumstances and, as necessary, seek professional advice.


Join The Conversation
For specific platform feedback and suggestions, please submit it directly to our team using these instructions.
If you have an account-specific question or concern, please reach out to Client Services.
We encourage you to look through our FAQs before posting. Your question may already be covered!