


: Identifying Mean-Reversion with Statistical Tests")


1/ Markets Gaming Tariffs
2/ When Will the Inflation Matter?
3/ Don’t Forget Money
4/ Banking System Rolling?
5/ The Greenback’s Impact
Investopedia is partnering with CMT Association on this newsletter. The contents of this newsletter are for informational and educational purposes only, however, and do not constitute investing advice. The guest authors, which may sell research to investors, and may trade or hold positions in securities mentioned herein do not represent the views of CMT Association or Investopedia. Please consult a financial advisor for investment recommendations and services.
1/
Markets Gaming Tariffs
Over the past 27 years since I entered “the business,” I’ve seen it all in these markets—LTCM, bursting bubbles, financial collapses, and pandemics. Now, let’s add tariffs, which are just as significant to the economy as the tax reform that launched the bull market in 2017. What’s interesting about the tariffs, however, is the market’s response. In this first chart, the market is pricing in a decline in margins—an expectation that companies will absorb some of the tariff costs—which in turn is projected to weigh on forward earnings growth. Typically, the 10-year yield, as shown in the chart, tracks margin trends, but since “liberation day” in April, it has moved in the opposite direction. So, following Dollar General’s earnings call Tuesday morning, in which the company noted expanding margins, is the market misreading the impact of tariffs?
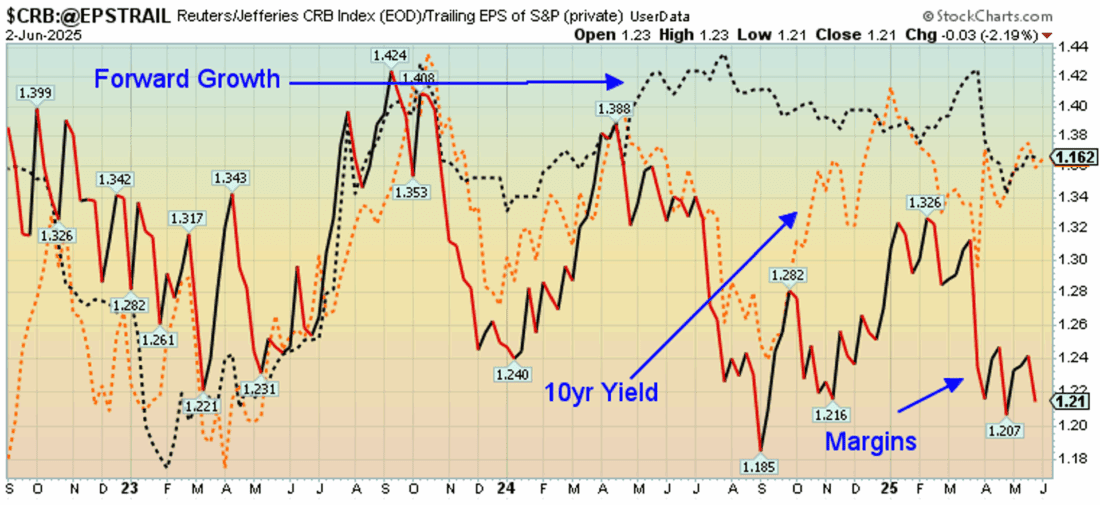
While Dollar General is not the definitive “tell” for the entire market, it does suggest that the extreme conclusions investors have drawn about margin pressures may not materialize—at least in the short term. At the same time, if the 10-year yield is no longer responding to margins but instead to inflation concerns, then consider when the divergence began: last fall’s election. Most believe that current White House has no problem pushing the growth side of the ledger. When combined with the large amount of money in the system, that argues for a potential surge in demand and inflation. Thus the break.
2/
When Will the Inflation Matter?
This next chart shows current Fed overnight policy conditions relative to where the market is pricing they should be. The Fed Fair model—one I created years ago—helps monitor when market conditions are likely to be more volatile than normal. When the fair value of the Fed funds target is below the actual target, markets tend to be choppier, and vice versa. As an aside, some of the greatest equity market “crashes,” if you will, have occurred under tight Fed policy according to this model—but that’s a post for another day. In any case, while the market is pricing in an inflation storm via the 10-year yield, the current Fed funds target remains tight, which argues that inflation should continue to moderate. Today’s PCE reading of 2.5%, down from 2.7% a year ago, supports that view.
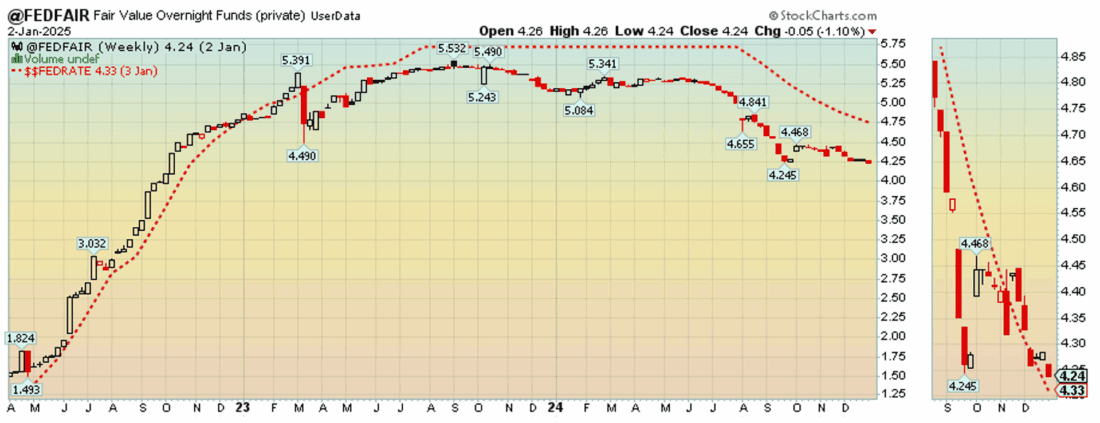
The policy mistake the Fed could make at this point would be cutting rates, which would make this model indicate an “easy” stance—potentially setting the stage for a surge in inflation, theoretically driven by rising demand.
3/
Don’t Forget Money
While the Fed funds target is an important part of the equation, another key factor to consider is market liquidity and its ultimate effect on inflation. Since the Global Financial Crisis, liquidity has been the primary driver of asset prices. Every major surge in liquidity has coincided with rising asset values, and that dynamic was once again evident this spring, as shown in the chart. With the S&P and broader risk assets selling off this spring, helped by the continued rising risk in volatility and the drop in the Dollar, liquidity surged to offset this drop which turned the VIX lower (higher on this chart) and the S&P 500 higher. As the S&P climbs, remember, wealth increases and thus the “demand available for goods,” also rises.
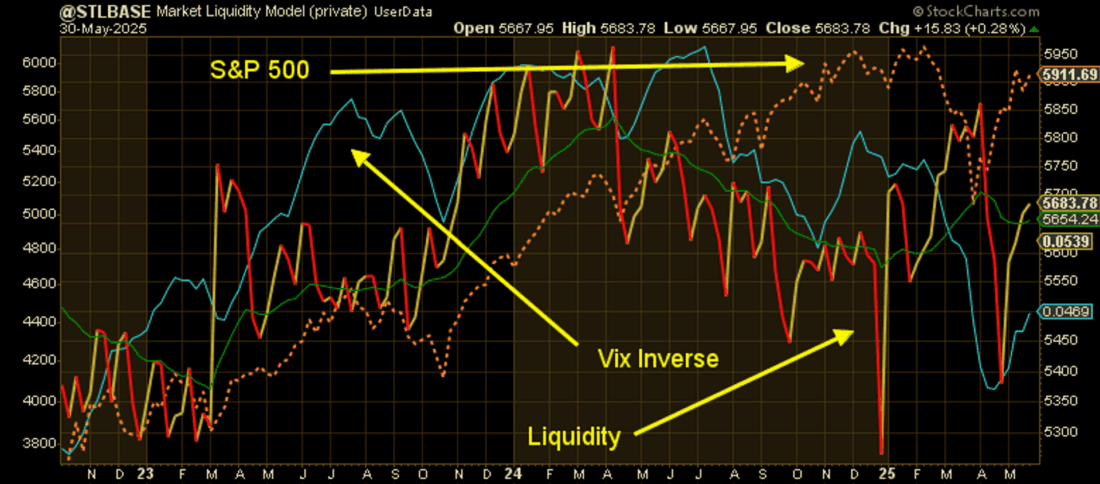
What’s interesting about this surge in liquidity is its volatile nature—massive amounts of money are moving through the system, which could be attributed to factors such as the 10% drop in the S&P or the breakout in Bitcoin. Typically, however, liquidity measures fluctuating this dramatically tend to do more harm than good for the economy, as they increase uncertainty around capital flows. In addition, they impact the banking system and lending conditions, which also impacts the economy. It is the best interest of regulators to have stable money and stable rates – not the opposite.
4/
Banking System Rolling?
This next chart features my “banking system” model, which I use as a leading indicator of potential trouble. It has served me well over the years—notably during the GFC and other periods—and incorporates the movement of bank stocks relative to overall market liquidity. As the chart shows, banks rebounded from their lows faster than the broader market (thanks to liquidity), but have since stalled and are now showing signs of a potential rollover. The next two panels display the relative movement of forward EPS to trailing EPS for the S&P 500—which is now moving sideways, suggesting stagnant economic conditions—and the S&P 500 itself, which is approaching prior highs.
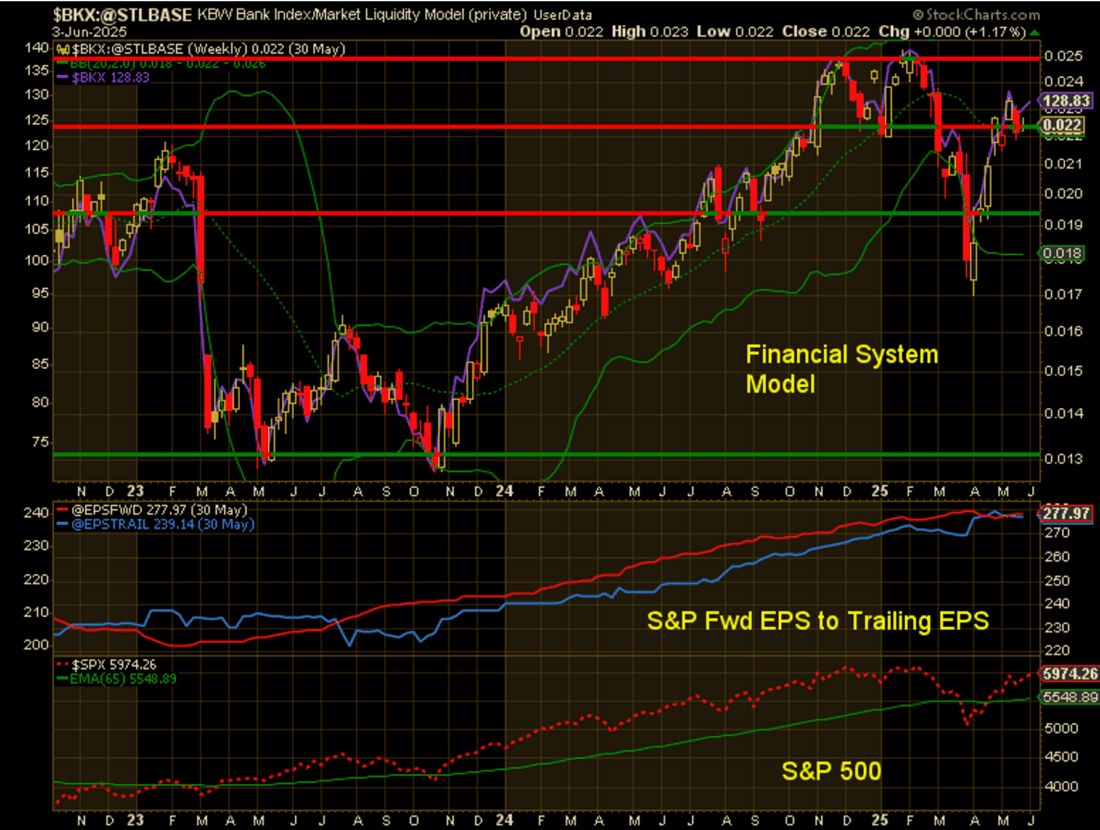
Putting on my trader’s hat, if the banks begin to roll over from current levels, this could very well set up an important top in the S&P 500 —even with the recent surge in system-wide liquidity. This is unusual; surging liquidity has historically stabilized the banking sector, with the S&P typically rising alongside it. Is the declining dollar having a destabilizing effect on our banks? Furthermore, if the dollar is experiencing capital flight, could that be what’s creating the gap shown in the first chart—between corporate margins and the 10-year yield? The bottom line for this chart: as goes the banking system, so go risk assets and the broader economy—which brings me to the dollar.
5/
The Greenback’s Impact
I’m not one to forecast the end of dollar supremacy or echo the many arguments against it, but I find the current movement in the dollar more curious than ever. The chart below shows my Dollar Model compared to the Dollar Index. The model peaked before the end of 2024 and has been declining steadily since January. The spring bounce was sold into, and the dollar has continued to hover near its lows. As it bounces along those lows, interest rates—as shown in the first chart—have been climbing.
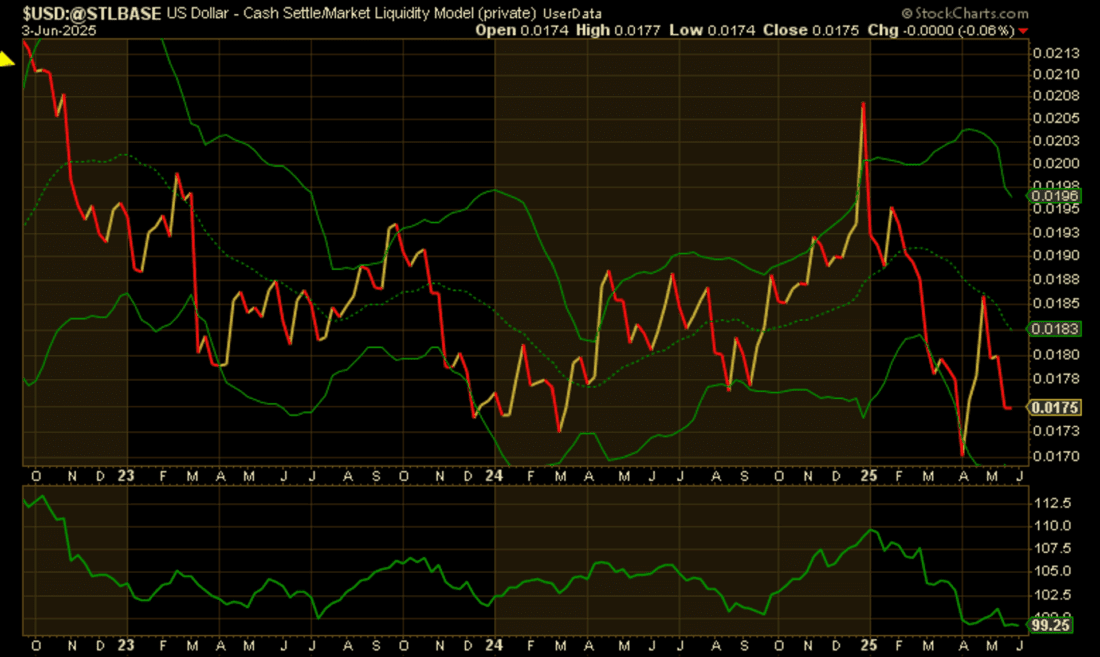
From a technical perspective, the 99–102 range has been a key support zone where buyers have stepped in over the past few years for the Dollar Index. Prior to that, 102 served as the upper bound of the 96–102 range. The recent bounce to 102, followed by consistent selling in the weeks since, suggests that further dollar weakness may be ahead. If 10-year yield, have been sold en masse as the dollar has declined, does this imply, by extension, that interest rates are poised to climb further?
What follows next should be telling for the markets, the banking system and the economy. More on this in the week ahead.
—
Originally posted 4th June 2025
Disclosure: Investopedia
Investopedia.com: The comments, opinions and analyses expressed herein are for informational purposes only and should not be considered individual investment advice or recommendations to invest in any security or to adopt any investment strategy. While we believe the information provided herein is reliable, we do not warrant its accuracy or completeness. The views and strategies described on our content may not be suitable for all investors. Because market and economic conditions are subject to rapid change, all comments, opinions and analyses contained within our content are rendered as of the date of the posting and may change without notice. The material is not intended as a complete analysis of every material fact regarding any country, region, market, industry, investment or strategy. This information is intended for US residents only.
Disclosure: Interactive Brokers Third Party
Information posted on IBKR Campus that is provided by third-parties does NOT constitute a recommendation that you should contract for the services of that third party. Third-party participants who contribute to IBKR Campus are independent of Interactive Brokers and Interactive Brokers does not make any representations or warranties concerning the services offered, their past or future performance, or the accuracy of the information provided by the third party. Past performance is no guarantee of future results.
This material is from Investopedia and is being posted with its permission. The views expressed in this material are solely those of the author and/or Investopedia and Interactive Brokers is not endorsing or recommending any investment or trading discussed in the material. This material is not and should not be construed as an offer to buy or sell any security. It should not be construed as research or investment advice or a recommendation to buy, sell or hold any security or commodity. This material does not and is not intended to take into account the particular financial conditions, investment objectives or requirements of individual customers. Before acting on this material, you should consider whether it is suitable for your particular circumstances and, as necessary, seek professional advice.
Disclosure: ETFs
Any discussion or mention of an ETF is not to be construed as recommendation, promotion or solicitation. All investors should review and consider associated investment risks, charges and expenses of the investment company or fund prior to investing. Before acting on this material, you should consider whether it is suitable for your particular circumstances and, as necessary, seek professional advice.
Disclosure: Cryptocurrency based Exchange Traded Products (ETPs)
Cryptocurrency based Exchange Traded Products (ETPs) are high risk and speculative. Cryptocurrency ETPs are not suitable for all investors. You may lose your entire investment. For more information please view the RISK DISCLOSURE REGARDING COMPLEX OR LEVERAGED EXCHANGE TRADED PRODUCTS.
Disclosure: Forex
There is a substantial risk of loss in foreign exchange trading. The settlement date of foreign exchange trades can vary due to time zone differences and bank holidays. When trading across foreign exchange markets, this may necessitate borrowing funds to settle foreign exchange trades. The interest rate on borrowed funds must be considered when computing the cost of trades across multiple markets.


Join The Conversation
For specific platform feedback and suggestions, please submit it directly to our team using these instructions.
If you have an account-specific question or concern, please reach out to Client Services.
We encourage you to look through our FAQs before posting. Your question may already be covered!