
- Solve real problems with our hands-on interface
- Progress from basic puts and calls to advanced strategies
Interactive Options Course
Posted June 4, 2025 at 11:15 am
Click to View this Option in the NVDA Option Chain Profit Calculator
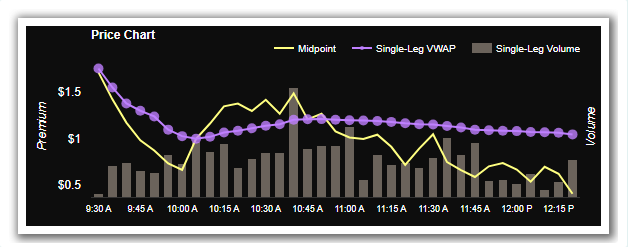
Nvidia (NVDA) has captured the spotlight yet again, not just for its stock performance but for its options market action. As of 10:30 AM, the Jun-06-25 140 Call stood out as the single most traded option, racking up an impressive 58,736 contracts—making up a significant 8% of the stock’s entire options volume for the session. The backdrop? NVDA stock was up 2.76% at $141.17, marking a gain of $3.79 on the day.
| Contract | Volume | Open Interest | Trade Price VWAP | Implied Volatility | IV Change (%) |
|---|---|---|---|---|---|
| Jun-06-25 140 Call | 58,736 | 63,636 | 2.08 | 30.6 | -1.3 |
The trade volume for this 140 call is even more striking when you consider the flow: 52.4% of the trades were classified as ‘buys’ against 47.4% ‘sells.’ The data points to a near balance between bullish and bearish sentiment, with a slight bullish edge—just as the stock notched new intraday highs.
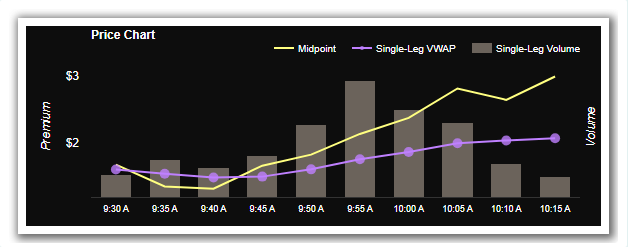
The average trade price (VWAP) for the contract was $2.08, while prices traded as low as $1.25 and as high as $3.15. With the last trade going through at $3.12, there’s clear evidence of heightened demand as NVDA surged.
What’s perhaps more telling: small or retail traders accounted for 54% of the trades, while institutional or professional-sized trades made up 46%. While this hints at robust participation from individual investors, nearly half the volume involved sizable professional hands, indicating cross-market conviction on the potential for further upside—or at least a hedge against downside moves.
| Implied Volatility (Last) | Previous Day Close IV | Open IV | Low IV | High IV |
|---|---|---|---|---|
| 32.1 | 31.0 | 28.8 | 28.8 | 32.6 |
Implied volatility (IV) for the contract closed yesterday at 31.0 and saw a slight dip of 1.3% to 30.6, trading in a relatively tight band between 28.8 and 32.6 today. While the drop in IV could suggest lower near-term fear, the persistent interest in call buying—paired with today’s price momentum—implies traders aren’t shy about expressing bullish views as the next expiry approaches.
What does this record call volume mean for NVDA’s short-term trajectory? While we can’t definitively determine whether these trades represent new positions or the unwinding of old ones, the scale of the activity—paired with a balanced buy/sell split and strong price action—signals significant anticipation for further movement.
With implied volatility holding steady and both retail and institutional traders active, NVDA’s options market is telling a story of optimism tempered by a measure of caution. Traders might want to keep a close watch on both IV shifts and open interest trends as expiry nears—because today’s flurry of activity could be the precursor to another outsized move in Nvidia.
—
Originally Posted on June 3, 2025 – NVDA’s 140 Call Sees Massive 58,736 Contracts Traded—Is This 2.76% Stock Jump Fueling More Upside Bets?
Contact Information:
If you have feedback or concerns about the content, please feel free to reach out to us via email at support@marketchameleon.com.
About the Publisher – Marketchameleon.com:
Marketchameleon is a comprehensive financial research and analysis website specializing in stock and options markets. We leverage extensive data, models, and analytics to provide valuable insights into these markets. Our primary goal is to assist traders in identifying potential market developments and assessing potential risks and rewards.
NOTE: Stock and option trading involves risk that may not be suitable for all investors. Examples contained within this report are simulated and may have limitations. Average returns and occurrences are calculated from snapshots of market mid-point prices and were not actually executed, so they do not reflect actual trades, fees, or execution costs. This report is for informational purposes only, and is not intended to be a recommendation to buy or sell any security. Neither Market Chameleon nor any other party makes warranties regarding results from its usage. Past performance does not guarantee future results. Please consult a financial advisor before executing any trades. You can read more about option risks and characteristics at theocc.com.
The information is provided for informational purposes only and should not be construed as investment advice. All stock price information is provided and transmitted as received from independent third-party data sources. The Information should only be used as a starting point for doing additional independent research in order to allow you to form your own opinion regarding investments and trading strategies. The Company does not guarantee the accuracy, completeness or timeliness of the Information.
The information provided on MarketChameleon is for educational and informational purposes only. It should not be considered as financial or investment advice. Trading and investing in financial markets involve risks, and individuals should carefully consider their own financial situation and consult with a professional advisor before making any investment decisions. MarketChameleon does not guarantee the accuracy, completeness, or reliability of the information provided, and users acknowledge that any reliance on such information is at their own risk. MarketChameleon is not responsible for any losses or damages resulting from the use of the platform or the information provided therein. The 7-day free trial is offered for evaluation purposes only, and users are under no obligation to continue using the service after the trial period.
Information posted on IBKR Campus that is provided by third-parties does NOT constitute a recommendation that you should contract for the services of that third party. Third-party participants who contribute to IBKR Campus are independent of Interactive Brokers and Interactive Brokers does not make any representations or warranties concerning the services offered, their past or future performance, or the accuracy of the information provided by the third party. Past performance is no guarantee of future results.
This material is from Market Chameleon and is being posted with its permission. The views expressed in this material are solely those of the author and/or Market Chameleon and Interactive Brokers is not endorsing or recommending any investment or trading discussed in the material. This material is not and should not be construed as an offer to buy or sell any security. It should not be construed as research or investment advice or a recommendation to buy, sell or hold any security or commodity. This material does not and is not intended to take into account the particular financial conditions, investment objectives or requirements of individual customers. Before acting on this material, you should consider whether it is suitable for your particular circumstances and, as necessary, seek professional advice.
Options involve risk and are not suitable for all investors. For information on the uses and risks of options, you can obtain a copy of the Options Clearing Corporation risk disclosure document titled Characteristics and Risks of Standardized Options by going to the following link ibkr.com/occ. Multiple leg strategies, including spreads, will incur multiple transaction costs.
Related Articles


Join The Conversation
For specific platform feedback and suggestions, please submit it directly to our team using these instructions.
If you have an account-specific question or concern, please reach out to Client Services.
We encourage you to look through our FAQs before posting. Your question may already be covered!