
- Solve real problems with our hands-on interface
- Progress from basic puts and calls to advanced strategies
Interactive Options Course

Posted June 3, 2025 at 2:11 pm
The article “Cut Through the Noise! These Two Factors Tend to Drive Portfolio Success” was originally posted on Alpha Architect blog.
Let’s break down how to build a robust factor portfolio—without getting lost in the weeds. Three steps. No fluff. Here’s what we’re covering:
And yeah, we’ll get nerdy. That’s just what we do.
If you want to watch the video version of this blog, make sure to follow us on our YouTube channel.
Simple: because factors represent independent sources of risk and return—which means real diversification potential. Going back to modern portfolio theory 101, investors should target assets that:
Historically, factors have delivered both. And because you can layer them on top of existing asset class exposures—most notably, equities—they’ve historically added distinct return streams beyond what the broad market provides.
Even a modest edge—say, a 1% annual bump—can do major damage (in a good way) over time. That’s compounding at work.
To keep things focused, let’s zero in on four main factors and see which have historically offered both return and diversification benefits:
We pulled the data from the Kenneth French data library to run a simple horse race to see which factors have done the heavy lifting.
First up: The long/short version
This approach buys the top-ranked stocks and shorts the bottom-ranked ones—essentially isolating the factor premium. Here’s how these factors stack up:
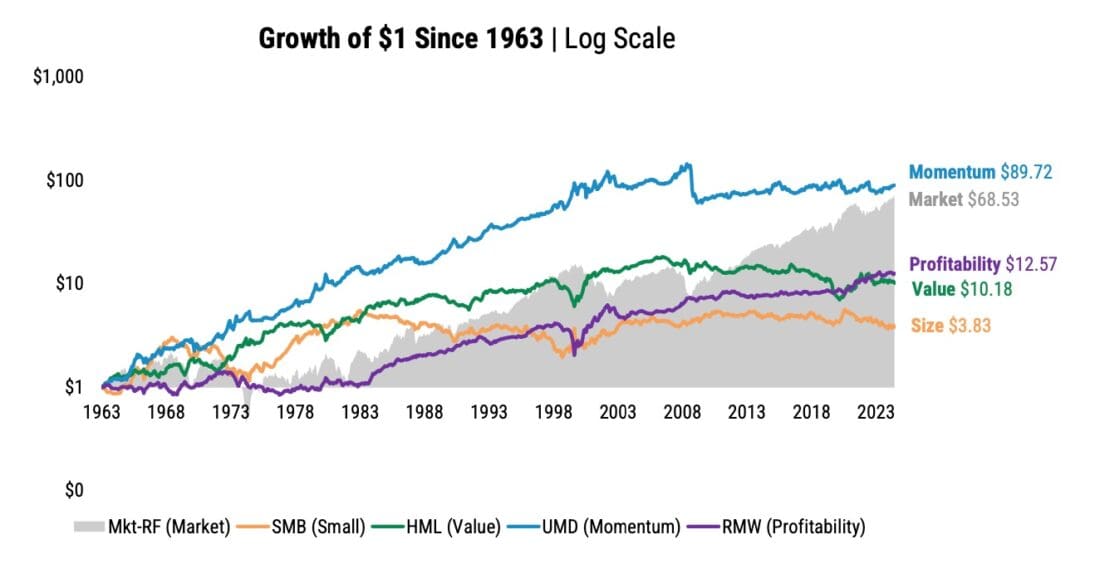
Source: Kenneth French Data Library, Tuck School of Business at Dartmouth. 07/01/1963 – 12/31/2024. Growth of $1 (log scale). Chart begins in July, 1963 as a common date of inception for data availability. The results are hypothetical results and are NOT an indicator of future results and do NOT represent returns that any investor actually attained. Indexes are unmanaged and do not reflect management or trading fees, and one cannot invest directly in an index.
At first glance, it’s tempting to say, “Great—momentum wins, let’s bet the farm!” But hold up!
Long/short portfolios might look great on paper, but they’re tough to run in real life. Besides, most investors don’t actually allocate by shorting the ‘other side’ of the bet. And in the wrong market environment, these strategies can absolutely blow up.
So let’s pivot to something more realistic: long-only portfolios. No shorting. Just buying the top-decile stocks.
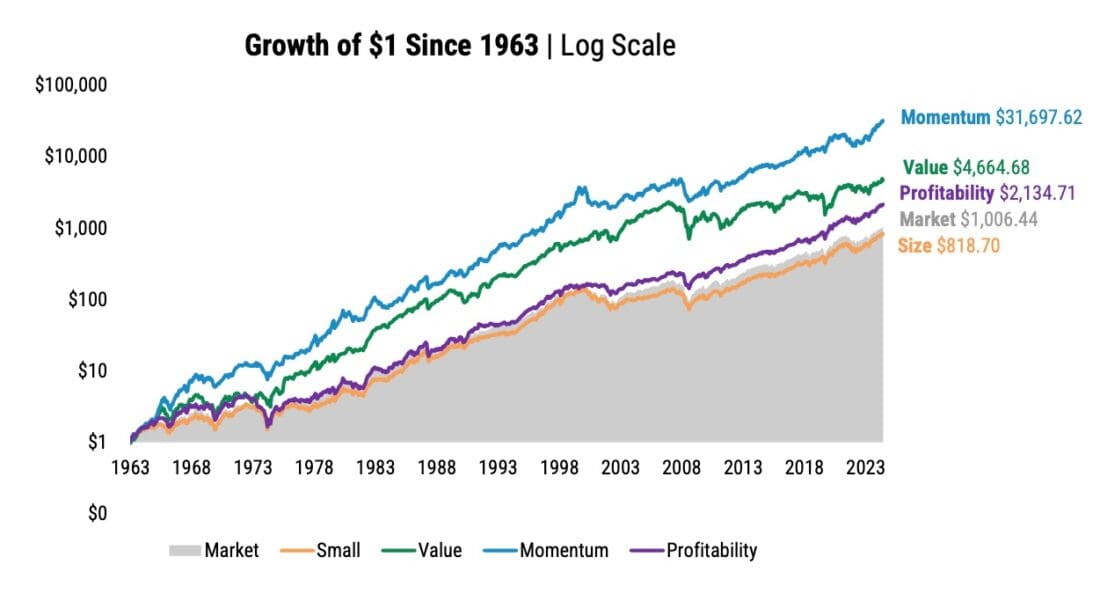
Source: Kenneth French Data Library, Tuck School of Business at Dartmouth. 07/01/1963 – 12/31/2024. Growth of $1 (log scale). Portfolios represent the top decile in each factor, value-weighted. Chart begins in July, 1963 as a common date of inception for data availability. The results are hypothetical results and are NOT an indicator of future results and do NOT represent returns that any investor actually attained. Indexes are unmanaged and do not reflect management or trading fees, and one cannot invest directly in an index.
Now things get interesting.
Here’s what $1 turned into (from 1963–today):
Sure—these are paper portfolios, gross of fees. But still. That’s pretty impressive. So if your only goal is maximizing return, value and momentum look like no-brainer candidates. But here’s the catch: They can go through long, painful droughts (hello, 2015–2020), and if you’re not mentally prepared, you’ll likely bail at the worst possible moment.
Conviction matters. And let’s be clear: conviction cannot be borrowed.
Let’s now move from theory to practice.
First off, if you’re an index investor looking for some factor exposure without completely blowing up your tracking error, diversification is the name of the game. To that end, let’s check the correlations between long-only factor portfolios:
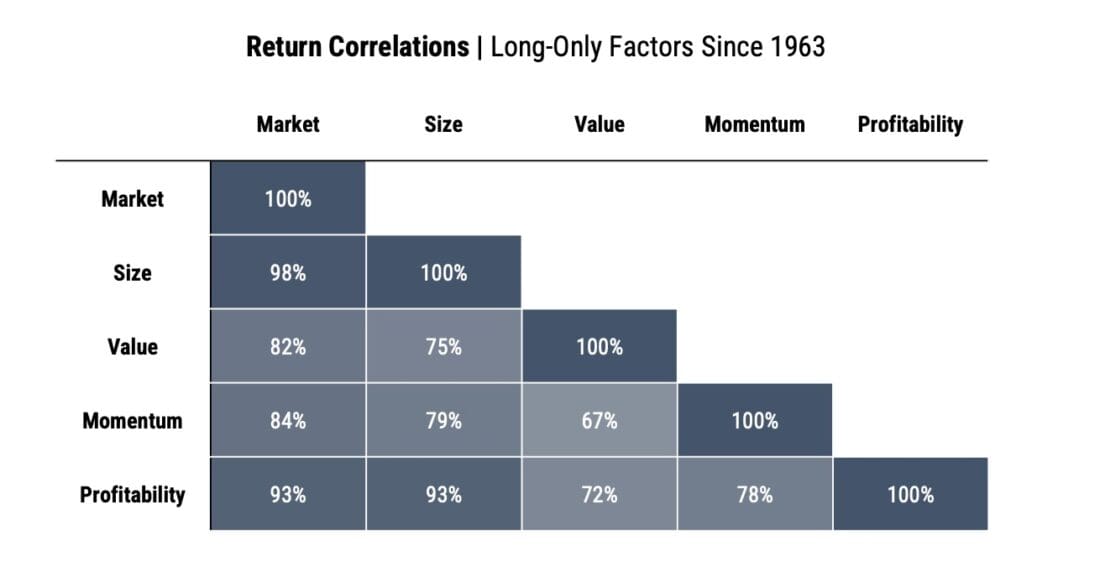
Source: Kenneth French Data Library, Tuck School of Business at Dartmouth. 07/01/1963 – 12/31/2024. Portfolios represent the top decile in each factor, value-weighted. Data begins in July, 1963 as a common date of inception for data availability. The results are hypothetical results and are NOT an indicator of future results and do NOT represent returns that any investor actually attained. Indexes are unmanaged and do not reflect management or trading fees, and one cannot invest directly in an index.
Translation: They’re not just the strongest return generators in this data set—they also appear to offer the most diversification benefits. When it comes to fulfilling our portfolio construction mandates, value and momentum seem to stand head and shoulders above the rest.
Alright, let’s say you’re sold. You want in. So how much of your equity sleeve should go into concentrated factor exposures?
There’s no magic number, but allocating 20–50% to concentrated factor exposures seems like a solid starting point for an equity sleeve. Less than 20% might not move the needle, while more than 50% could lead to wild tracking error (and some judgmental glances from your friends who index-and-chill).
The key is knowing your own behavioral limits.
In general, the more you can stomach looking different from the market, the more room you have to lean in. But if tracking error keeps you up at night, it’s better to ease off.
At the end of the day, it’s not just about what you believe—it’s about what you can stick with.
The views and opinions expressed herein are those of the author and do not necessarily reflect the views of Alpha Architect, its affiliates or its employees. Our full disclosures are available here. Definitions of common statistics used in our analysis are available here (towards the bottom).
This site provides NO information on our value ETFs or our momentum ETFs. Please refer to this site.
Information posted on IBKR Campus that is provided by third-parties does NOT constitute a recommendation that you should contract for the services of that third party. Third-party participants who contribute to IBKR Campus are independent of Interactive Brokers and Interactive Brokers does not make any representations or warranties concerning the services offered, their past or future performance, or the accuracy of the information provided by the third party. Past performance is no guarantee of future results.
This material is from Alpha Architect and is being posted with its permission. The views expressed in this material are solely those of the author and/or Alpha Architect and Interactive Brokers is not endorsing or recommending any investment or trading discussed in the material. This material is not and should not be construed as an offer to buy or sell any security. It should not be construed as research or investment advice or a recommendation to buy, sell or hold any security or commodity. This material does not and is not intended to take into account the particular financial conditions, investment objectives or requirements of individual customers. Before acting on this material, you should consider whether it is suitable for your particular circumstances and, as necessary, seek professional advice.


Join The Conversation
For specific platform feedback and suggestions, please submit it directly to our team using these instructions.
If you have an account-specific question or concern, please reach out to Client Services.
We encourage you to look through our FAQs before posting. Your question may already be covered!