


: Identifying Mean-Reversion with Statistical Tests")


1/ Zscaler Inc. (ZS)
2/ Candlestick Chart
3/ Point and Figure Chart
Investopedia is partnering with CMT Association on this newsletter. The contents of this newsletter are for informational and educational purposes only, however, and do not constitute investing advice. The guest authors, which may sell research to investors, and may trade or hold positions in securities mentioned herein do not represent the views of CMT Association or Investopedia. Please consult a financial advisor for investment recommendations and services.
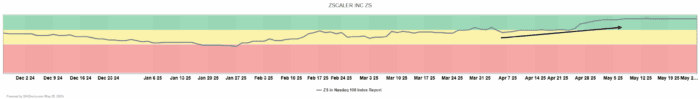
1/
Zscaler Inc. (ZS)
Shares of Zscaler Inc. (ZS) have been on the march, alongside other peers in the cybersecurity space. Earlier this month, SIA highlighted shares of CrowdStrike, Palantir, Broadcom, and Fortinet as a cluster of names that have moved up in unison into the favored zone of the SIA NASDAQ 100 Index Report. Zscaler—a cloud-based cybersecurity company that helps organizations securely connect users to applications and data—is now being highlighted as a name that continues to improve technically. Its Zero Trust Exchange platform replaces traditional network security appliances with a cloud-native solution that inspects traffic in real time and enforces least-privilege access, significantly reducing risk in today’s hybrid work environments.
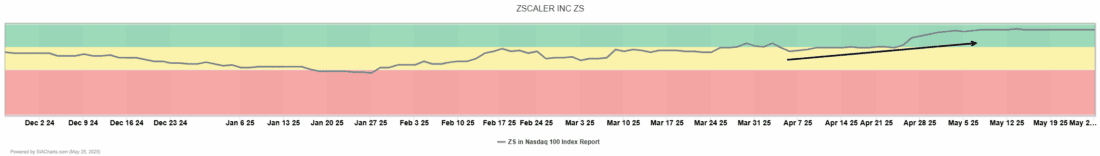
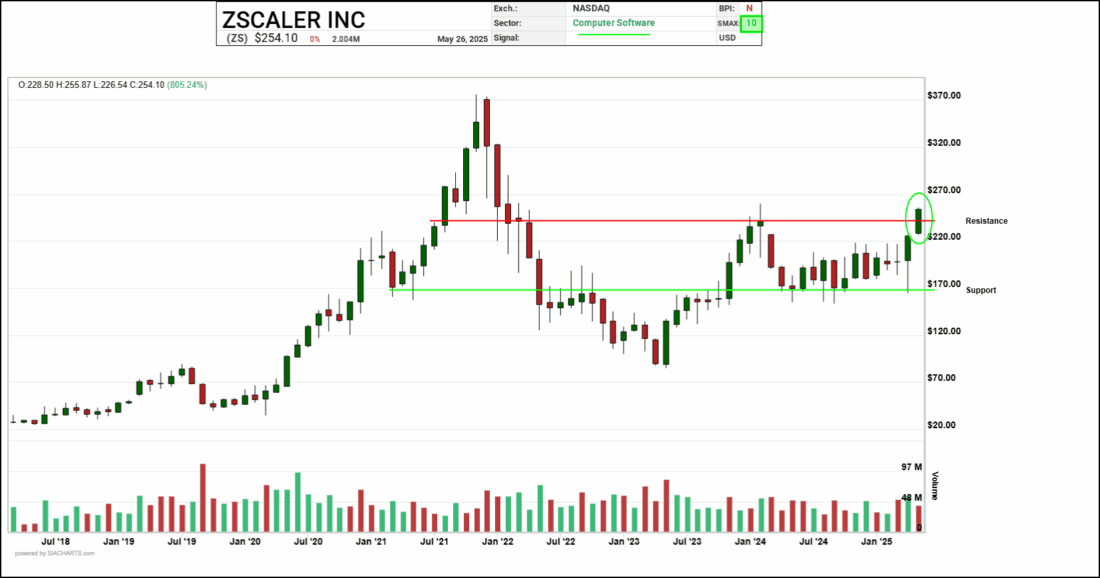
2/
Candlestick Chart
Shares of ZS moved into the favored zone on April 7 as a newcomer to the SIA Report and continue to climb, currently sitting at position #8. Having recently brushed up against resistance at the $250 level, the attached monthly candlestick chart provides an interesting lens to visualize the strength that buyers are exhibiting. The last two months of trading show tall bullish green candles with very little upper wick, suggesting that demand may be in control. Should sellers gain the upper hand, the lower green line at $170 could act as support. However, if current trends prevail, the upper zone around $370 might become the next major resistance level to watch.
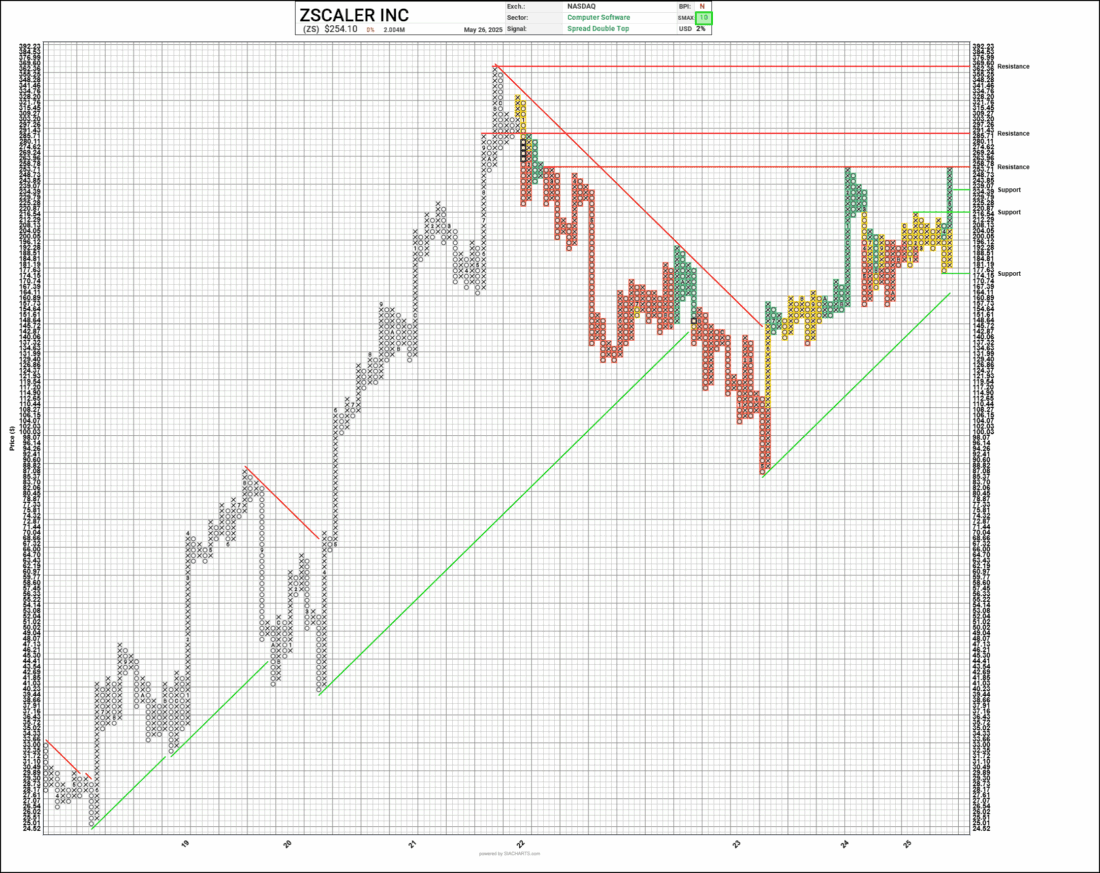
3/
Point and Figure Chart
Next, we turn to the Point and Figure (P&F) chart, where SIA has plotted three upper resistance levels and three supportive levels. The P&F chart has yet to confirm a breakout, which may require a move beyond $258.78. While today’s trading has reached the $257 range, it remains just below the breakout threshold. As such, risk-reward parameters may still be a challenge, given the proximity to the top of the current trading range. Support levels appear at $234.39, $216.54, and lower still at $174.15. On the upside, should a breakout occur, new P&F resistance levels are plotted (red lines) at $291.43 and $369.60.
All of this plays out against the backdrop of a strong SIA relative strength reading for Zscaler—ranking high compared to other stocks in the SIA NASDAQ 100 Index Report—and earning a perfect 10 out of 10 score when compared to the five other major asset classes.
—
Originally posted 30th April 2025
Disclosure: Investopedia
Investopedia.com: The comments, opinions and analyses expressed herein are for informational purposes only and should not be considered individual investment advice or recommendations to invest in any security or to adopt any investment strategy. While we believe the information provided herein is reliable, we do not warrant its accuracy or completeness. The views and strategies described on our content may not be suitable for all investors. Because market and economic conditions are subject to rapid change, all comments, opinions and analyses contained within our content are rendered as of the date of the posting and may change without notice. The material is not intended as a complete analysis of every material fact regarding any country, region, market, industry, investment or strategy. This information is intended for US residents only.
Disclosure: Interactive Brokers Third Party
Information posted on IBKR Campus that is provided by third-parties does NOT constitute a recommendation that you should contract for the services of that third party. Third-party participants who contribute to IBKR Campus are independent of Interactive Brokers and Interactive Brokers does not make any representations or warranties concerning the services offered, their past or future performance, or the accuracy of the information provided by the third party. Past performance is no guarantee of future results.
This material is from Investopedia and is being posted with its permission. The views expressed in this material are solely those of the author and/or Investopedia and Interactive Brokers is not endorsing or recommending any investment or trading discussed in the material. This material is not and should not be construed as an offer to buy or sell any security. It should not be construed as research or investment advice or a recommendation to buy, sell or hold any security or commodity. This material does not and is not intended to take into account the particular financial conditions, investment objectives or requirements of individual customers. Before acting on this material, you should consider whether it is suitable for your particular circumstances and, as necessary, seek professional advice.


Join The Conversation
For specific platform feedback and suggestions, please submit it directly to our team using these instructions.
If you have an account-specific question or concern, please reach out to Client Services.
We encourage you to look through our FAQs before posting. Your question may already be covered!