
- Solve real problems with our hands-on interface
- Progress from basic puts and calls to advanced strategies
Interactive Options Course
The types of macro events driving markets and dominating financial news and broker reports shift over time. Some periods are dominated by Federal Reserve meeting days, others by Consumer Price Index (CPI) or Non-Farm Payrolls (NFP), or even election days. We can quantify such shifts in attention by using index options data and looking at implied equity index moves.
Trading volumes in single-day S&P 500 options have been growing and, by linking them to macro news release dates, we can better understand shifts in how important the market believes these releases are for the broad equity market. The visual below plots the time series of event risk scores in recent years. As has been the case since the beginning of the monetary hiking cycle in 2022, Fed meeting days were typically the most important macro risk events for equities throughout 2024. This data also reveals an upward shift in relative importance of labor market data starting in the summer of 2024. That’s consistent with market concerns about a rising unemployment rate shifting focus away from the inflation side of the Fed’s dual mandate.
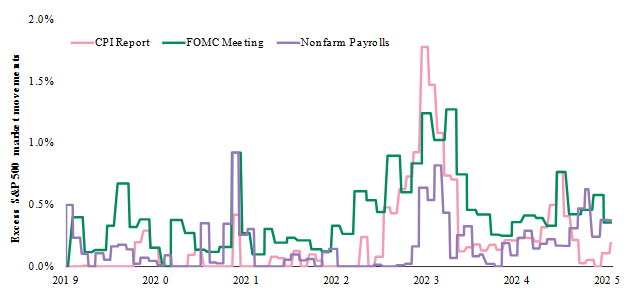
Source: BlackRock, with data from CBOE, as of January 27, 2025. Values are ‘excess’ moves priced into the SPX, so a value of 1 indicates a 1% ‘extra’ SPX move on that day (vs. a baseline ‘normal’ move).
Another way that we can use daily options data to understand shifts in the relevant equity risk drivers is to simply look at the days with the highest risk scores and then match them to a calendar of macro events. The table below shows the highest implied equity volatility days for 2024 and the associated event. Unsurprisingly, the November election topped the charts and was followed by some of the growth, inflation, and policy days that were plotted in the chart above. This table also highlights an important micro driver of market-level risk in 2024 – three of the top 15 riskiest days for the S&P 500 in 2024 were NVIDIA earnings release days.
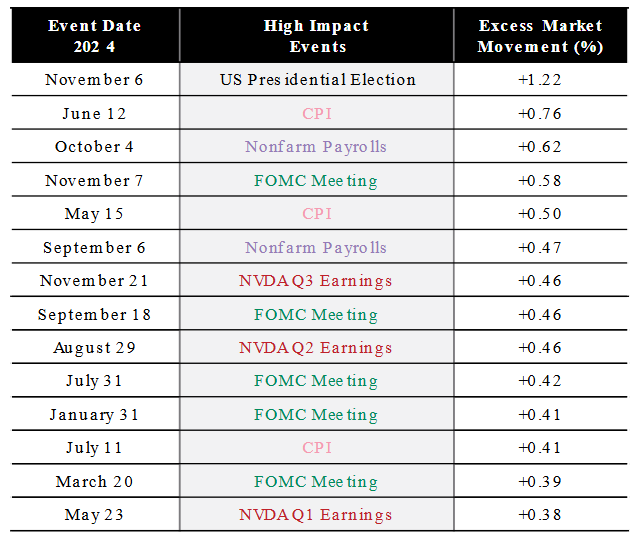
Source: BlackRock, with data from CBOE, as of January 27, 2025. Values are ‘excess’ moves priced into the SPX, so a value of 1 indicates a 1% ‘extra’ SPX move on that day (vs. a baseline ‘normal’ move).
Single company corporate earnings do not typically influence the overall riskiness of a broadly diversified index, particularly one that contains 500 distinct companies. The ability of NVIDIA earnings days to impact overall S&P 500 excess volatility in 2024 provides some insight into two important and related phenomena that we believe will be important for risk assets in 2025:
Portfolio positioning shifted underweight US equities relative to non-US equities in the aftermath of the US election, driven primarily by pricing and flows insights. In our view, the elevated concentration of the US equity index in conjunction with unbalanced positioning makes the S&P 500 less attractive than non-US markets on a tactical horizon at the outset of 2025. We have also added to directional short duration positioning in US Treasuries informed by the market’s relatively benign perception of inflation risk despite rising upside risks to the inflation outlook.
—
Originally Posted February 21, 2025 – What scares the S&P 500?
Performance data quoted represents past performance and is no guarantee of future results. Investment returns and principal values may fluctuate so that an investor’s shares, when redeemed, may be worth more or less than their original cost. All returns assume reinvestment of dividends and capital gains. Current performance may be lower or higher than that shown. Refer to blackrock.com for most recent month-end performance.
To obtain more information on the fund, including the Morningstar time period ratings and standardized average annual total returns as of the most recent calendar quarter and current month-end, please visit Tactical Opportunities Fund.
The Morningstar RatingTM for funds, or “star rating,” is calculated for managed products (including mutual funds, variable annuity and variable life subaccounts, exchange-traded funds, closed-end funds, and separate accounts) with at least a three-year history. Exchange-traded funds and open-ended mutual funds are considered a single population for comparative purposes. It is calculated based on a Morningstar Risk-Adjusted Return measure that accounts for variation in a managed product’s monthly excess performance, placing more emphasis on downward variations and rewarding consistent performance. The top 10% of products in each product category receive 5 stars, the next 22.5% receive 4 stars, the next 35% receive 3 stars, the next 22.5% receive 2 stars, and the bottom 10% receive 1 star. The Overall Morningstar Rating for a managed product is derived from a weighted average of the performance figures associated with its three-, five-, and 10-year (if applicable) Morningstar Rating metrics. The weights are: 100% three-year rating for 36-59 months of total returns, 60% five-year rating/40% three-year rating for 60-119 months of total returns, and 50% 10-year rating/30% five-year rating/20% three-year rating for 120 or more months of total returns. While the 10-year overall star rating formula seems to give the most weight to the 10-year period, the most recent three-year period actually has the greatest impact because it is included in all three rating periods.
©2022 BlackRock, Inc. All rights reserved. BLACKROCK is a registered trademark of BlackRock, Inc., or its subsidiaries in the United States and elsewhere. All other marks are the property of their respective owners.
Information posted on IBKR Campus that is provided by third-parties does NOT constitute a recommendation that you should contract for the services of that third party. Third-party participants who contribute to IBKR Campus are independent of Interactive Brokers and Interactive Brokers does not make any representations or warranties concerning the services offered, their past or future performance, or the accuracy of the information provided by the third party. Past performance is no guarantee of future results.
This material is from BlackRock and is being posted with its permission. The views expressed in this material are solely those of the author and/or BlackRock and Interactive Brokers is not endorsing or recommending any investment or trading discussed in the material. This material is not and should not be construed as an offer to buy or sell any security. It should not be construed as research or investment advice or a recommendation to buy, sell or hold any security or commodity. This material does not and is not intended to take into account the particular financial conditions, investment objectives or requirements of individual customers. Before acting on this material, you should consider whether it is suitable for your particular circumstances and, as necessary, seek professional advice.
Options involve risk and are not suitable for all investors. For information on the uses and risks of options, you can obtain a copy of the Options Clearing Corporation risk disclosure document titled Characteristics and Risks of Standardized Options by going to the following link ibkr.com/occ. Multiple leg strategies, including spreads, will incur multiple transaction costs.
Related Articles
 | EPAT Project")


")


Join The Conversation
For specific platform feedback and suggestions, please submit it directly to our team using these instructions.
If you have an account-specific question or concern, please reach out to Client Services.
We encourage you to look through our FAQs before posting. Your question may already be covered!