
- Solve real problems with our hands-on interface
- Progress from basic puts and calls to advanced strategies
Interactive Options Course
Posted January 24, 2025 at 3:24 am
The S&P 500: What’s Next After Breaking 5850?
Investopedia is partnering with CMT Association on this newsletter. The contents of this newsletter are for informational and educational purposes only, however, and do not constitute investing advice. The guest authors, which may sell research to investors, and may trade or hold positions in securities mentioned herein do not represent the views of CMT Association or Investopedia. Please consult a financial advisor for investment recommendations and services.
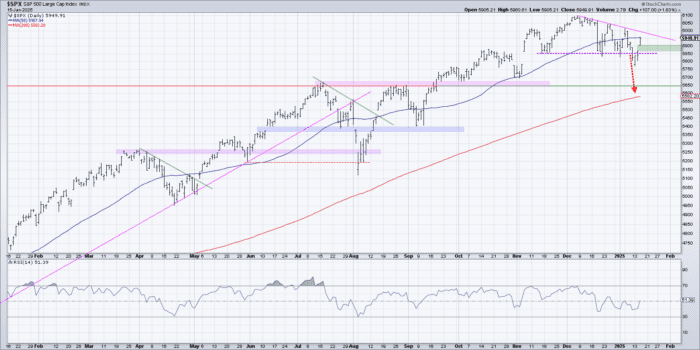
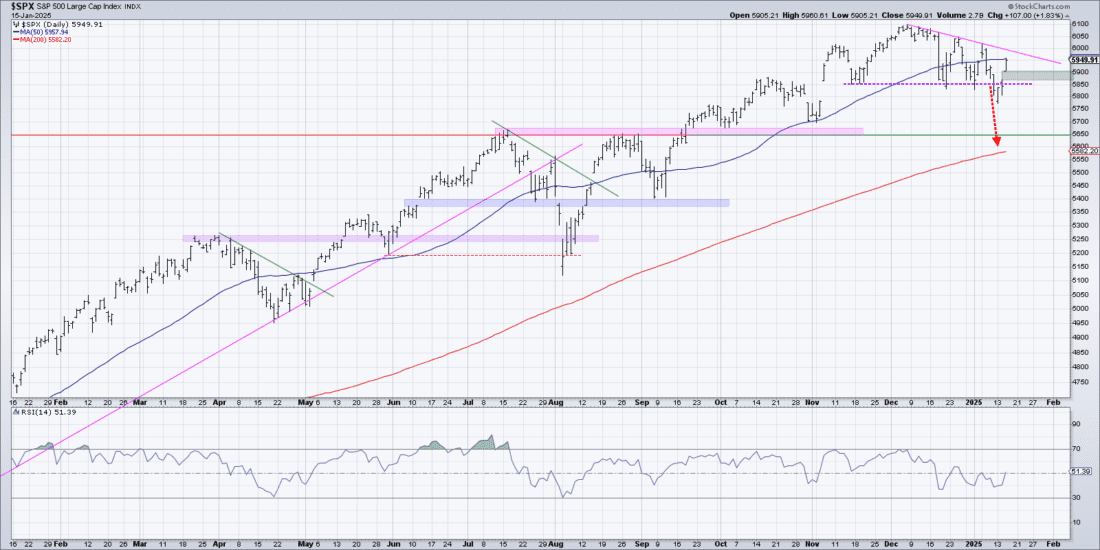
Let’s talk about the big move we’ve been anticipating—the S&P 500 has finally dipped below our “line in the sand” at 5850. And then just as quickly, the SPX popped right back above this key support level! Here’s what stands out as I’m reviewing the chart of the S&P 500.
A Market in Red
As of last Friday, January 10, the market wasn’t exactly painting a pretty picture. The S&P 500 was flirting with lower numbers, and no sector has been spared. Growth favorites like tech? Down. Sturdy value plays like financials, industrials, and healthcare? Also down. Across the board, it was all red.
If you’ve been following along on my market recap show, CHART THIS with Dave Keller, you know we’ve been keeping an eye on the market’s weakening breadth since mid-December. This latest break below 5850 is just another confirmation of what’s been brewing: key sectors are losing steam.
Why the Close Matters
So, after a key breakdown, what happens next? First, we need to confirm that this break below 5850 is the real deal. It’s not just about dipping below that level during the day—it’s about where the market closes. Why? Because closing prices carry more weight when assessing trends.
For example, we’ve seen the S&P dip below 5850 a few times recently, only to rally back and close above it. Without a true close below that level, the market has kept the bears at bay. But if we do see a close below 5850, and the market follows through in the days after, that’s when things could start getting interesting.
After inflation data came out this week, we saw the SPX pop back above 5850 as investors considered the possibility of further rate cuts in the coming months. We feel 5850 remains the most important level to watch, because we are one lower high away from confirming a clear bearish trend for stocks.
Setting Downside Targets
If the S&P closes back below 5850 and momentum continues, where could it go? That’s where technical analysis gives us some tools to work with. Here are three ways we can identify potential downside targets:
When these methods point to the same general area, it’s a signal to pay attention.
The Big Picture
So, what’s the takeaway?
The goal here isn’t to predict exact levels but to stay tuned into the trends and adjust as the story unfolds. And as always, the charts will guide us.
—
Originally posted 23rd January 2025
Investopedia.com: The comments, opinions and analyses expressed herein are for informational purposes only and should not be considered individual investment advice or recommendations to invest in any security or to adopt any investment strategy. While we believe the information provided herein is reliable, we do not warrant its accuracy or completeness. The views and strategies described on our content may not be suitable for all investors. Because market and economic conditions are subject to rapid change, all comments, opinions and analyses contained within our content are rendered as of the date of the posting and may change without notice. The material is not intended as a complete analysis of every material fact regarding any country, region, market, industry, investment or strategy. This information is intended for US residents only.
Information posted on IBKR Campus that is provided by third-parties does NOT constitute a recommendation that you should contract for the services of that third party. Third-party participants who contribute to IBKR Campus are independent of Interactive Brokers and Interactive Brokers does not make any representations or warranties concerning the services offered, their past or future performance, or the accuracy of the information provided by the third party. Past performance is no guarantee of future results.
This material is from Investopedia and is being posted with its permission. The views expressed in this material are solely those of the author and/or Investopedia and Interactive Brokers is not endorsing or recommending any investment or trading discussed in the material. This material is not and should not be construed as an offer to buy or sell any security. It should not be construed as research or investment advice or a recommendation to buy, sell or hold any security or commodity. This material does not and is not intended to take into account the particular financial conditions, investment objectives or requirements of individual customers. Before acting on this material, you should consider whether it is suitable for your particular circumstances and, as necessary, seek professional advice.
Related Articles


Join The Conversation
For specific platform feedback and suggestions, please submit it directly to our team using these instructions.
If you have an account-specific question or concern, please reach out to Client Services.
We encourage you to look through our FAQs before posting. Your question may already be covered!