
- Solve real problems with our hands-on interface
- Progress from basic puts and calls to advanced strategies
Interactive Options Course
Lesson 2 of 6
New to Interactive Brokers?
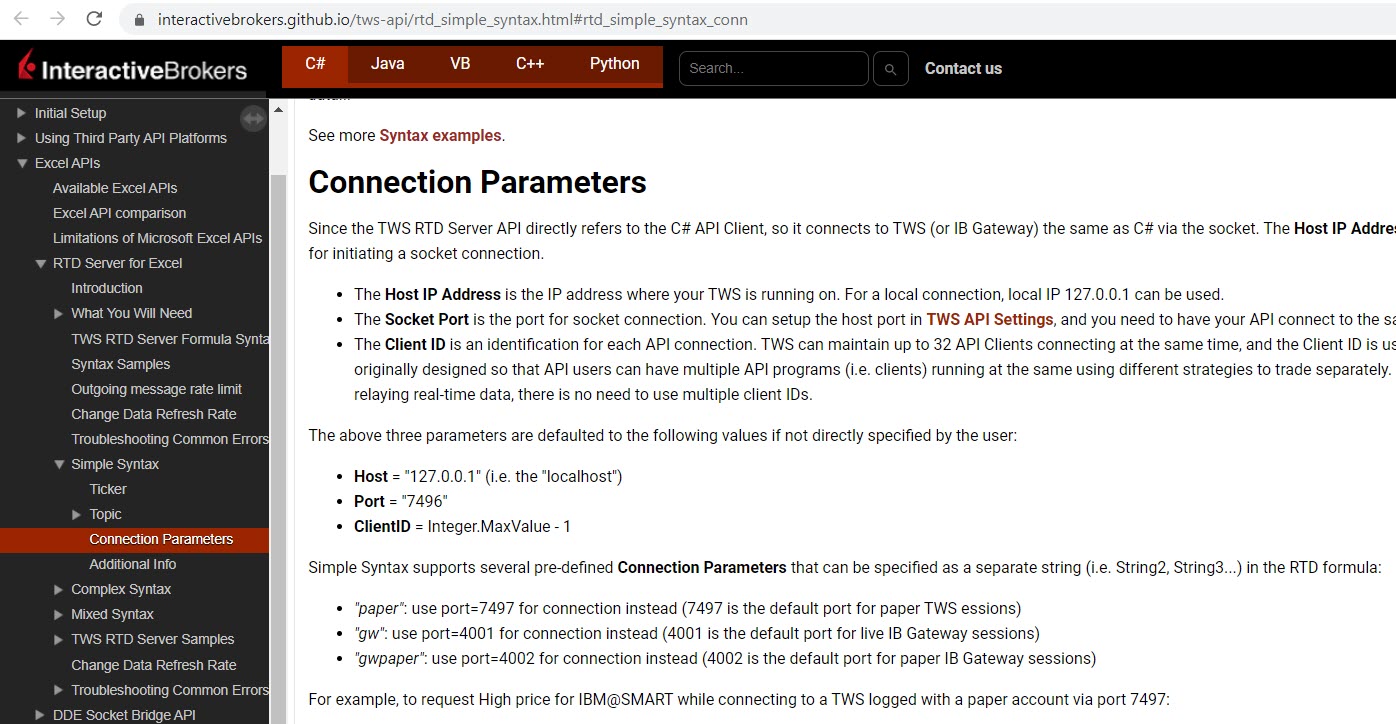
=RTD("tws.twsrtdserverctrl",,"sym=AMZN", "sec=STK", "exch=SMART", "cur=USD", "qt=Last")The “qt=” topic string tells which market data column to request from TWS. Available quote types/tick types can be found in the following page. Tick types are different quote types which are available for different instruments supported by TWS. The data relayed back for these ticks is equivalent to the data displayed in its corresponding TWS market data column. As can be seen here, tick types include bid, ask, last, volume, etc. Each RTD formula is able to relay back data for a single tick type.
After the formula has been entered into a cell, Excel will begin to query and update the price automatically. I’ll just hit Enter and now you’ll see the prices are updating. Note, due to limitations of the RTD technology and Excel, there may be some delay when comparing the price values in Excel and TWS, as Excel cannot update the displayed values as quickly as the API sends them. Now this is how to query the last price for AMZN using the simple syntax:=RTD("tws.twsrtdserverctrl",," AMZN@SMART")The sample syntax page will provide more details and the link will be included in the study notes.=RTD("tws.twsrtdserverctrl",,"sym=AMZN", "sec=STK", "exch=SMART", "cur=USD", "genticks=165", "qt=Week52Hi")Note: Not all generic ticks are supported for all instrument types. If you request data for an unsupported tick, you may receive error 321, Incorrect generic tick list, which will also tell you the supported generic ticks for the instrument. If you obtain this error or do not receive the expected data, you may verify the values returned in the TWS. If the TWS market data type is not listed in our documentation, it will not be returned in the API, however. Next, let’s check out an example to obtain dividend information. Again, you may enter the formula shown here and hit Return to display the information.=RTD("tws.twsrtdserverctrl",,"sym=AMZN", "sec=STK", "exch=SMART", "cur=USD", "genticks=456", "qt=IBDividends")For specific platform feedback and suggestions, please submit it directly to our team using these instructions.
If you have an account-specific question or concern, please reach out to Client Services.
We encourage you to look through our FAQs before posting. Your question may already be covered!
The analysis in this material is provided for information only and is not and should not be construed as an offer to sell or the solicitation of an offer to buy any security. To the extent that this material discusses general market activity, industry or sector trends or other broad-based economic or political conditions, it should not be construed as research or investment advice. To the extent that it includes references to specific securities, commodities, currencies, or other instruments, those references do not constitute a recommendation by IBKR to buy, sell or hold such investments. This material does not and is not intended to take into account the particular financial conditions, investment objectives or requirements of individual customers. Before acting on this material, you should consider whether it is suitable for your particular circumstances and, as necessary, seek professional advice.
The views and opinions expressed herein are those of the author and do not necessarily reflect the views of Interactive Brokers, its affiliates, or its employees.
Please keep in mind that the examples discussed in this material are purely for technical demonstration purposes, and do not constitute trading advice. Also, it is important to remember that placing trades in a paper account is recommended before any live trading.


How can I plot selected Options Greeks onto the Advanced Charts in IRB Trader Workstation?
Hello, thank you for reaching out. At this time, it is not possible to plot options Greeks on Advanced Charts. We have passed your feedback to the appropriate team. You can also view this FAQ for instructions to submit any specific suggestion(s) on how we can improve: https://www.ibkr.com/faq?id=32653353
Also, you can also post in the Feature Poll in Client Portal where other IBKR users can comment and vote:
https://portal.interactivebrokers.com/portal/#/suggestions
Please reach back out with any additional questions. We are here to help!
I try to copy paste syntax above in my excel 2010. but no one is working. there is error: The formula you type contains an error…. please help
Thank you for reaching out. Please create a web ticket for this inquiry; we have a category specifically for “API.” One of our API experts will be happy to guide you! https://spr.ly/IBKR_TicketCampus
Is it possible to access the indicator values that TWS is calculating on a particular chart. My Use Case is that I am monitoring the ES emini contract. I am able to get it’s information via RTD into excel. On my chart in TWS desktop I have applied a volatility stop. I am wanting the volatility stop value as calculated by TWS to be shared to my excel file … is that doable ? Also, where do i find the algorithm for that volatility stop (in the trend studies) – that way I can build it outside TWS if necessary. Thanks
Thank you for reaching out. Indicator values are not available through the API. Interactive Brokers does not provide our formula calculations. If you have any additional questions, please create a web ticket for this inquiry. We have a category specifically for “API.” One of our API experts will be happy to guide you. https://spr.ly/IBKR_ClientServicesCampus
Please, what is wrong in thsi formula: =RTD(“tws.twsrtdserverctrl”;;”sym=SI”; “sec=FUT”; “exch=CMX”; “cur=USD”; “exp=202505”; “qt=last”) Thank you very much.
Hello, thank you for reaching out. Please try modifying your exchange to “COMEX” and test the behavior. If the issue persists, please create a ticket with our customer service team. You can find the steps to create a ticket here: https://www.ibkrguides.com/complianceportal/creatingaticket.htm.
What is wrong with this formula for spot gold price: =RTD(“tws.twsrtdserverctrl”,,”sym=XAUUSD”, “sec=CASH”, “exch=IDEALPRO”, “cur=USD”, “qt=Last”). It returns “wsRtdServer error: No security definition has been found for the request”.
Hello Ronnie, thank you for reaching out. Taking a look at the contract, it seems we may be conflating the XAUUSD commodities contract with a Forex Pair. If we were to search XAUUSD in TWS, we can see that the XAUUSD contract is held on the “SMART” exchange and is a CMDTY security type. If you have any additional questions, please create a web ticket for this inquiry; we have a category specifically for “API.” One of our API experts will be happy to guide you! https://spr.ly/IBKR_ClientServicesCampus
We hope this helps!