2022 should have been a great year for renewables. The prices of fossil fuels, which they are supposed to replace, have jumped. Russia’s invasion of Ukraine has heightened the importance of energy security, which solar panels and windmills offer because most countries can find places to build them. And global Green House Gas emissions (GHGs) have rebounded following the dip caused by the pandemic. So why aren’t renewables stocks riding high?
One reason could be that some of them had benefited from the long rally in tech stocks. Investors in both sectors are typically relying on high growth rates which means years of waiting for a reasonable free cash flow yield. Rising interest rates put a higher discount rate on those delayed future earnings.
A more likely answer is that investors are becoming more realistic about the profitability of renewables. Germany’s north coast is windy, but they and others scrambling to replace Russian natural gas did not bid up the price of windmills. Instead, they hoovered up every available Floating Storage and Regasification Unit (FSRU) on the planet. The onshore pier, pipelines and electricity lines for the first one were completed last week in a brief 194 days in Wilhelmshaven on the North Sea. They’re also planning to build onshore import terminals for LNG, which have greater capacity than FSRUs.
European LNG prices famously reached ten times the US price earlier in the summer before dropping back to around 5X now. European storage is full in preparation for winter. Dozens of LNG tankers are idling offshore waiting for better prices before they unload their cargoes. Many analysts expect it’ll be harder to replenish stocks for next winter, since Russian gas was flowing west through Nord Stream 1 for the first half of this year.

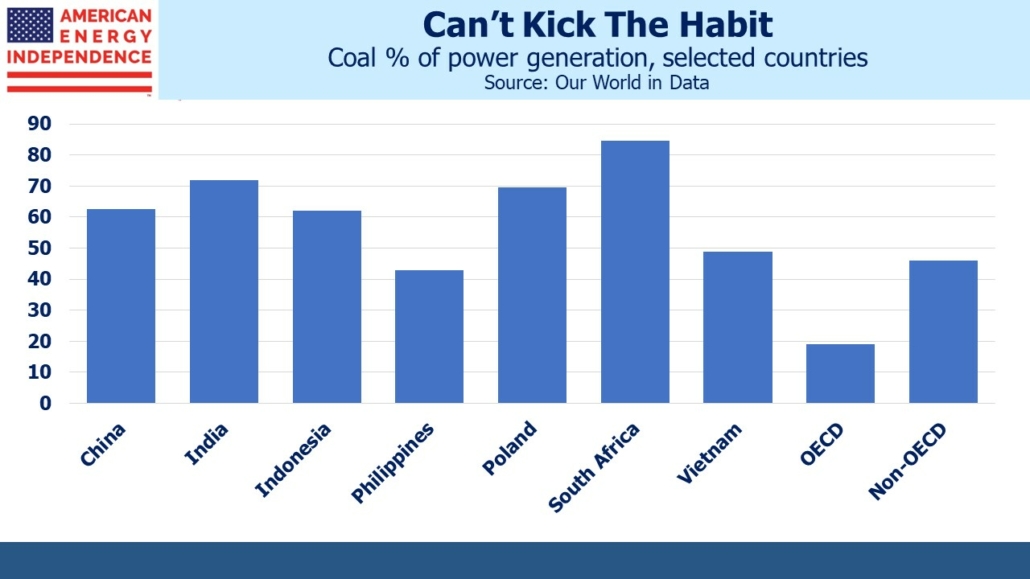
Coal prices have soared as developing countries have been deterred from competing with Europe’s new appetite for LNG. Among non-OECD (ie developing) countries coal provides 46% of their power, versus only 19% in the rich world. And developing countries are where energy demand is growing.
China burns half the world’s coal and relies on it for 63% of their electricity. They’ve even justified new coal plants as necessary for energy security (what’s Chinese for chutzpah?). Egypt is making government buildings and shopping malls turn their air conditioning up to 77° F, thereby reducing domestic demand for natural gas so they can export more.

Coal and gas together provide 59% of the world’s electricity, and both are much more expensive than a year ago. It’s as if the world had agreed on carbon taxes to improve the economics of renewables. There are numerous articles stating that solar and wind are cheaper than reliable energy, most of which pre-date the run-up in coal and gas. Renewables stocks should be soaring.
But they’re not. Danish wind turbine manufacturer Vestas expects a profit margin this year of minus 5% and recently reported a bigger 3Q loss than expected. They are optimistic that they can boost prices over the long run.
The CEO of Siemens Energy reminded viewers on CNBC that, “renewables like wind roughly, roughly, need 10 times the material [compared to] what conventional technologies need.” Current fiscal year EBITDA is down 42% and the company isn’t planning to pay a dividend.
UK solar operator Toucan Energy has gone bankrupt, with debts including £655 million ($779 million) to Thurrock Council, the local government where it operates. Neighboring London averages 1,481 hours of sunshine a year, which is 17% (Tampa, FL is 33%). 48% of UK electricity comes from natural gas. Although solar is 7%, UK solar farms can expect 83% or more downtime. Combined cycle natural gas power plants are typically down 5% of the time for maintenance. That’s why Toucan borrowed money from a local government rather than return-oriented investors.

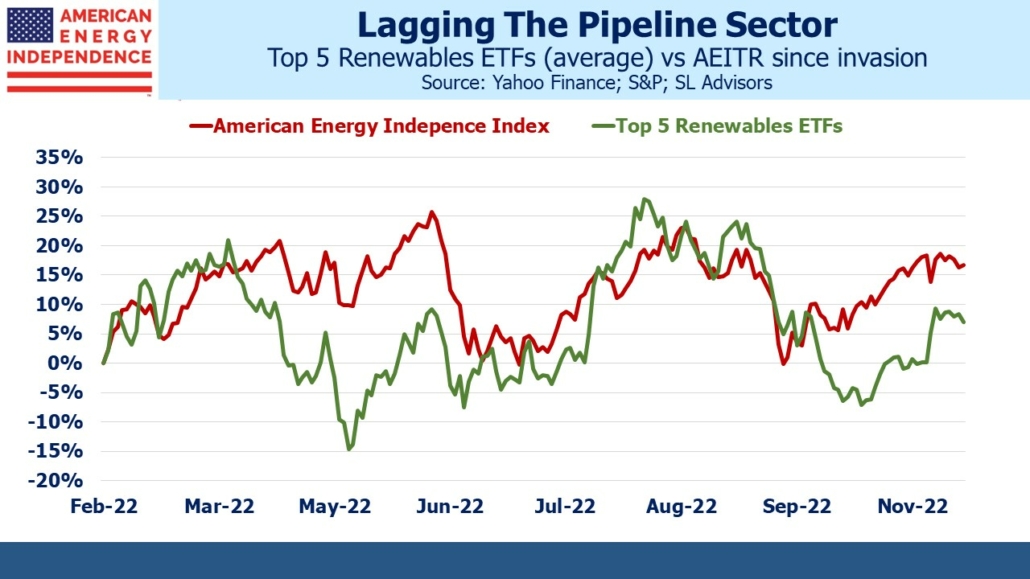
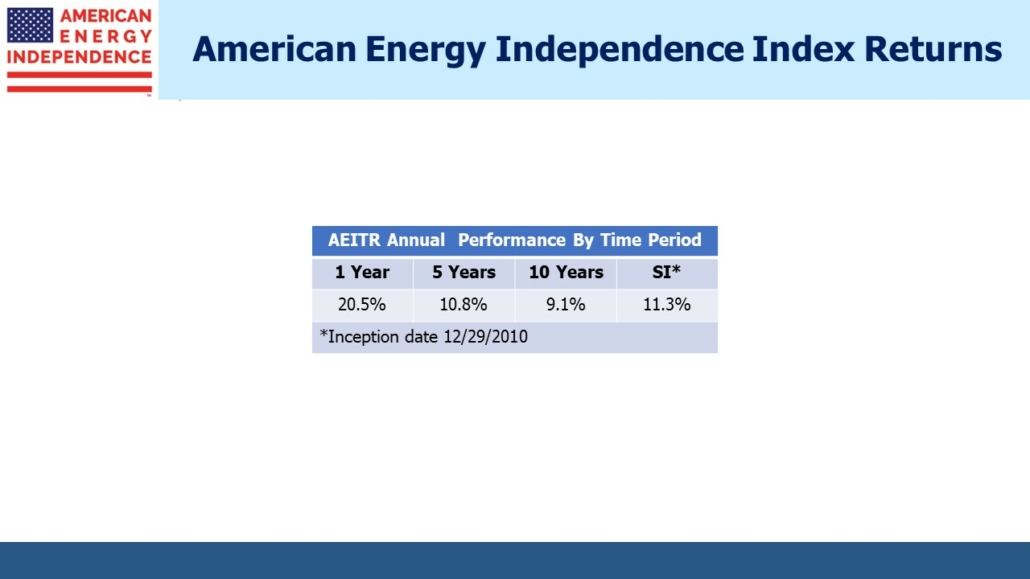
The five biggest renewables ETFs are beating the S&P500 but lagging the American Energy Independence Index (AEITR). The global economy is rebounding from Covid, apart from China. Relying on foreign countries for energy is suddenly riskier. Fossil-fuel inputs for almost 60% of the world’s electricity have jumped in price. All these factors should have made renewables a hot sector.
Instead, a weary realism has cooled belief in a rapid energy transition. Developing countries are looking for very large payments from the rich world to help them invest in cleaner energies. This challenges the claims of those who argue that solar and wind are already the cheapest way to generate electricity.
The International Energy Agency (IEA) forecasts 0.5% annual production growth in natural gas through 2030 in their Stated Policies Scenario (STEPS). This is the most plausible one because it doesn’t assume every government’s climate pledges will be fulfilled. In their 2022 World Energy Outlook the IEA expects unconventional gas production (ie shale, overwhelmingly US) to grow at 2% annually. They estimate 750 million people don’t have access to electricity, and 2.4 billion don’t have access to clean cooking (meaning they cook using fuelwood, charcoal, tree leaves, crop residues or animal dung). Getting these families onto natural gas would improve their lives and leave the planet better off as well.

—
Originally Posted November 20, 2022 – Why Aren’t Renewables Stocks Soaring?
Important Disclosures
The information provided is for informational purposes only and investors should determine for themselves whether a particular service, security or product is suitable for their investment needs. The information contained herein is not complete, may not be current, is subject to change, and is subject to, and qualified in its entirety by, the more complete disclosures, risk factors and other terms that are contained in the disclosure, prospectus, and offering. Certain information herein has been obtained from third party sources and, although believed to be reliable, has not been independently verified and its accuracy or completeness cannot be guaranteed. No representation is made with respect to the accuracy, completeness or timeliness of this information. Nothing provided on this site constitutes tax advice. Individuals should seek the advice of their own tax advisor for specific information regarding tax consequences of investments. Investments in securities entail risk and are not suitable for all investors. This site is not a recommendation nor an offer to sell (or solicitation of an offer to buy) securities in the United States or in any other jurisdiction.
References to indexes and benchmarks are hypothetical illustrations of aggregate returns and do not reflect the performance of any actual investment. Investors cannot invest in an index and do not reflect the deduction of the advisor’s fees or other trading expenses. There can be no assurance that current investments will be profitable. Actual realized returns will depend on, among other factors, the value of assets and market conditions at the time of disposition, any related transaction costs, and the timing of the purchase. Indexes and benchmarks may not directly correlate or only partially relate to portfolios managed by SL Advisors as they have different underlying investments and may use different strategies or have different objectives than portfolios managed by SL Advisors (e.g. The Alerian index is a group MLP securities in the oil and gas industries. Portfolios may not include the same investments that are included in the Alerian Index. The S & P Index does not directly relate to investment strategies managed by SL Advisers.)
This site may contain forward-looking statements relating to the objectives, opportunities, and the future performance of the U.S. market generally. Forward-looking statements may be identified by the use of such words as; “believe,” “expect,” “anticipate,” “should,” “planned,” “estimated,” “potential” and other similar terms. Examples of forward-looking statements include, but are not limited to, estimates with respect to financial condition, results of operations, and success or lack of success of any particular investment strategy. All are subject to various factors, including, but not limited to general and local economic conditions, changing levels of competition within certain industries and markets, changes in interest rates, changes in legislation or regulation, and other economic, competitive, governmental, regulatory and technological factors affecting a portfolio’s operations that could cause actual results to differ materially from projected results. Such statements are forward-looking in nature and involves a number of known and unknown risks, uncertainties and other factors, and accordingly, actual results may differ materially from those reflected or contemplated in such forward-looking statements. Prospective investors are cautioned not to place undue reliance on any forward-looking statements or examples. None of SL Advisors LLC or any of its affiliates or principals nor any other individual or entity assumes any obligation to update any forward-looking statements as a result of new information, subsequent events or any other circumstances. All statements made herein speak only as of the date that they were made. r
Certain hyperlinks or referenced websites on the Site, if any, are for your convenience and forward you to third parties’ websites, which generally are recognized by their top level domain name. Any descriptions of, references to, or links to other products, publications or services does not constitute an endorsement, authorization, sponsorship by or affiliation with SL Advisors LLC with respect to any linked site or its sponsor, unless expressly stated by SL Advisors LLC. Any such information, products or sites have not necessarily been reviewed by SL Advisors LLC and are provided or maintained by third parties over whom SL Advisors LLC exercise no control. SL Advisors LLC expressly disclaim any responsibility for the content, the accuracy of the information, and/or quality of products or services provided by or advertised on these third-party sites.
All investment strategies have the potential for profit or loss. Different types of investments involve varying degrees of risk, and there can be no assurance that any specific investment will be suitable or profitable for a client’s investment portfolio.
Past performance of the American Energy Independence Index is not indicative of future returns.
Disclosure: SL Advisors
Please go to following link for important legal disclosures: http://sl-advisors.com/legal-disclosure
SL Advisors is invested in all the components of the American Energy Independence Index via the ETF that seeks to track its performance.
Disclosure: Interactive Brokers Third Party
Information posted on IBKR Campus that is provided by third-parties does NOT constitute a recommendation that you should contract for the services of that third party. Third-party participants who contribute to IBKR Campus are independent of Interactive Brokers and Interactive Brokers does not make any representations or warranties concerning the services offered, their past or future performance, or the accuracy of the information provided by the third party. Past performance is no guarantee of future results.
This material is from SL Advisors and is being posted with its permission. The views expressed in this material are solely those of the author and/or SL Advisors and Interactive Brokers is not endorsing or recommending any investment or trading discussed in the material. This material is not and should not be construed as an offer to buy or sell any security. It should not be construed as research or investment advice or a recommendation to buy, sell or hold any security or commodity. This material does not and is not intended to take into account the particular financial conditions, investment objectives or requirements of individual customers. Before acting on this material, you should consider whether it is suitable for your particular circumstances and, as necessary, seek professional advice.
Disclosure: ETFs
Any discussion or mention of an ETF is not to be construed as recommendation, promotion or solicitation. All investors should review and consider associated investment risks, charges and expenses of the investment company or fund prior to investing. Before acting on this material, you should consider whether it is suitable for your particular circumstances and, as necessary, seek professional advice.
Disclosure: Displaying Symbols on Video
Any stock, options or futures symbols displayed are for illustrative purposes only and are not intended to portray recommendations.


Join The Conversation
For specific platform feedback and suggestions, please submit it directly to our team using these instructions.
If you have an account-specific question or concern, please reach out to Client Services.
We encourage you to look through our FAQs before posting. Your question may already be covered!