I wish I could lose weight easily. But it’s a slow process at best. I’m coming around to the idea that redistributing my existing weight could have benefits as well.
Market capitalization weighted indices never have the opportunity to lose weight. By definition, their components make up 100% of the index. But as stocks move up and down, their weight distribution can change – sometimes abruptly.
We have frequently discussed how top-heavy the NASDAQ 100 Index (NDX) is. The market capitalization of its largest components so concentrated that the top 7 companies make up about 40% of its weight. That was a big problem two days ago, when its second and third largest components Microsoft (MSFT) and Alphabet (GOOG, GOOGL) fell sharply after earnings. The gloom continued yesterday when the sixth largest company Meta Platforms (META) lost about a fifth of its value. Things looked even more grim when the first and fourth largest companies, Apple (AAPL) and Amazon (AMZN) both sold off after yesterday’s close.
Since then, both have improved rather considerably. AMZN remains about 10% lower, but it has pared much of last night’s drop. Meanwhile, AAPL went from being down about 4% after the close to up 7% this morning. It wasn’t clear why AAPL was initially punished for beating its estimates. Maybe it was a slight miss on iPhone revenues, even though most other sectors did well. Sometimes a good night’s sleep can allow people to think more clearly.
AAPL’s rally has been a huge boon to NDX. It is not just a matter of an index benefitting from its largest stock moving higher. It is also that AAPL has become an even larger part of the index’ weight this week. The logic is simple – if AAPL is rising smartly while the next few largest companies have shrunk by 5-10% or more, then AAPL’s relative weight in NDX has grown. When your #1 stock represents about 14% of the index, and that #1 stock shoots up by 7%, it is a real boon – and far outweighs the #4 stock falling by 10%.
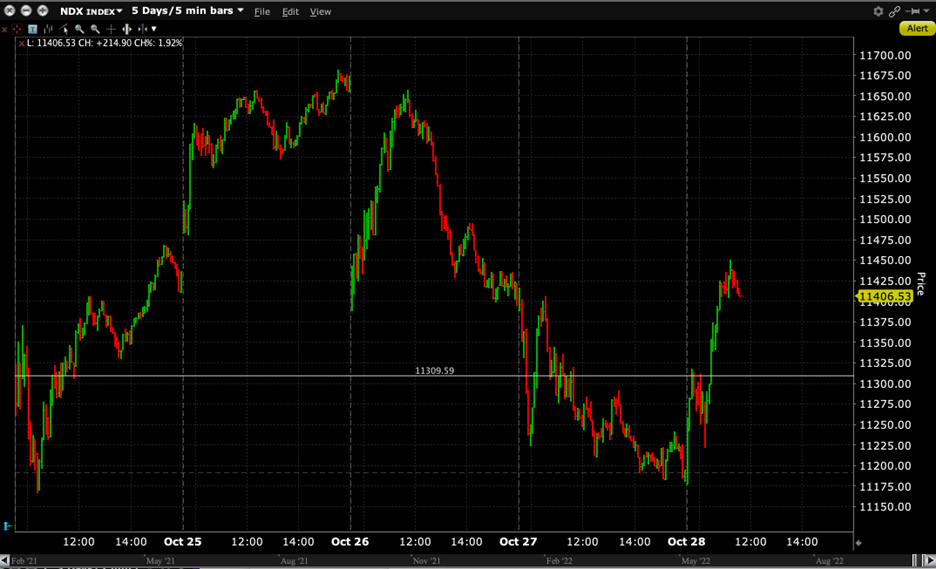
That is why we now see NDX being up for the week. Part of that is because the index rose quite sharply on Monday and Tuesday, part of it that it is being dominated today by AAPL’s rise (while some bargain hunting in MSFT and GOOG hasn’t hurt). Here’s the proof:
NDX 5-Day Chart, 5-Minute Bars with Last Friday’s Close Highlighted

Source: Interactive Brokers
While AAPL is also the largest stock in the S&P 500 Index (SPX), it is about half as important. That said, a steady stream of well-received earnings in many of that index’ key components – stocks like Caterpillar (CAT), McDonald’s (MCD), Exxon Mobil (XOM) and Chevron (CHV) – were able to provide their own source of lift to the index and blunted much of the negative impact of the megacap tech losses. SPX has spent the entire week in positive territory, as shown below:
NDX 5-Day Chart, 5-Minute Bars (red/green) with Last Friday’s Close Highlighted, alongside SPX (blue line)

Source: Interactive Brokers
Looking at the broader index’ technical picture, we see that SPX is at a potentially crucial technical level. It tested its 50-day moving average earlier this week, and is doing so once again. It is also nearing a test of its 100-day moving average, which is only about 1% above the 50-day. We see from the chart below that SPX rode its 50- and 100-day moving averages higher throughout 2021. Most support was provided by the 50-day, but the 100-day held up the trend in the few times that the 50-day couldn’t. So far in 2022, however, these moving averages have been less valuable indicators. Simply put, the higher volatility that we’ve seen this year has caused us to move through these formerly reliable levels with relative ease. (The 200-day put a lid on the summer rally, but it seems quite far away at its current 4100 level.)
SPX 2-Year Chart, Daily Bars with 50 (yellow), 100 (blue), and 200-Day (yellow) Moving Averages

Source: Interactive Brokers
Momentum feels rather strong today, so it wouldn’t surprise me much if we offered a successful test of these averages either later today or in the coming sessions. Let’s see how aggressive traders want to be ahead of Wednesday’s FOMC meeting.
Disclosure: Interactive Brokers
The analysis in this material is provided for information only and is not and should not be construed as an offer to sell or the solicitation of an offer to buy any security. To the extent that this material discusses general market activity, industry or sector trends or other broad-based economic or political conditions, it should not be construed as research or investment advice. To the extent that it includes references to specific securities, commodities, currencies, or other instruments, those references do not constitute a recommendation by IBKR to buy, sell or hold such investments. This material does not and is not intended to take into account the particular financial conditions, investment objectives or requirements of individual customers. Before acting on this material, you should consider whether it is suitable for your particular circumstances and, as necessary, seek professional advice.
The views and opinions expressed herein are those of the author and do not necessarily reflect the views of Interactive Brokers, its affiliates, or its employees.


Join The Conversation
For specific platform feedback and suggestions, please submit it directly to our team using these instructions.
If you have an account-specific question or concern, please reach out to Client Services.
We encourage you to look through our FAQs before posting. Your question may already be covered!