By now you should be well aware that that Nvidia (NVDA) is far and away the most important market story of the day. As I write this, the stock is up about 27%, just under its high of the day and more than 10% above its prior high of November 2021. Put simply, the earnings were quite good, and the guidance was spectacular.
We wrote yesterday that “much is riding on future guidance,” acknowledging that the company needed to demonstrate that its earnings were poised to rebound from a severe cryptocurrency hangover. (Bear in mind, they’re still below last year’s levels.) Next quarter’s Earnings Per Share (EPS) are now expected to set a record for the company at almost double this quarter’s level.
Yesterday, NVDA sported a trailing Price Earnings Ratio (P/E) of about 130, a forward P/E of 65 and a P/E to Growth (PEG) ratio of 2.78. It’s quite remarkable to consider that the stock is up 27% today, yet two of those numbers declined! On a trailing basis, NVDA’s 188 P/E is eye-watering, and a forward P/E of 55 is rather robust, but the new PEG of 2 is now slightly below Microsoft’s (MSFT) 2.18. Neither are cheap by conventional standards, but growth-oriented investors don’t mind paying a premium for demonstrable growth. And if NVDA can deliver on its guidance, the revenue and earnings growth would indeed be enviable.
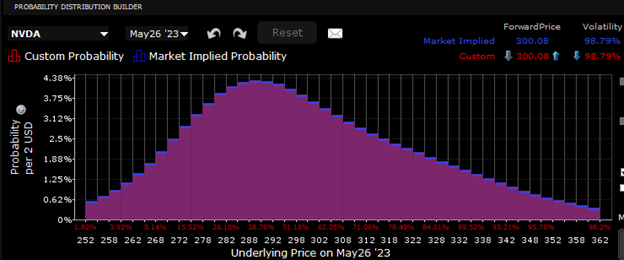
To say that the options markets didn’t see this coming would be an understatement. Quite simply, we don’t get 27% moves when things occur as expected. The IBKR Probability Lab displayed two standard deviations worth of strikes, and today’s move put us beyond the levels shown on yesterday’s graph. Remember also that the peak probabilities were for modest downside moves, meaning that there was high concern by hedgers.
IBKR Probability Lab for NDVA Options Expiring May 26th as of May 24th

Source: Interactive Brokers
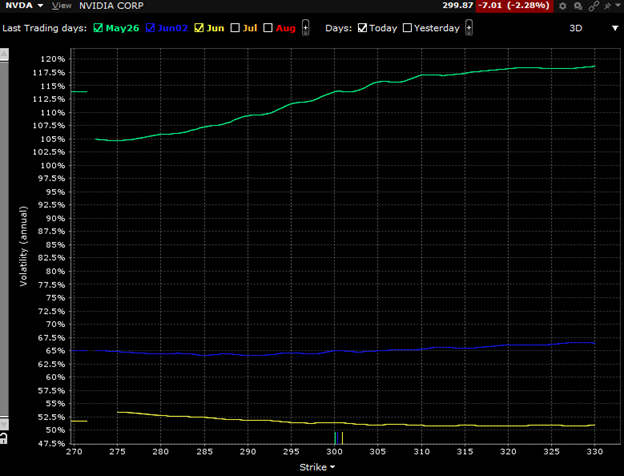
That said, there was no shortage of speculators bidding for upside options yesterday. Remember, the implied volatilities for upside calls were well above those of downside puts. Unfortunately, we cut off yesterday’s implied volatility graph at what seemed like a reasonable +/- 10%
NVDA Implied Volatility by Strike, May 26th (green), June 2nd (blue), June 16th (yellow) Expirations, as of May 24th

Source: Interactive Brokers
When we look back at recent history, it becomes apparent that NVDA’s current premium to the market is well above the heights reached during the cryptocurrency craze. We can also appreciate how much of an outlier that NVDA is when compared to both the NASDAQ 100 (NDX) and Philadelphia Semiconductor (SOX) indices. NVDA is a major component of both – it is the 4th largest stock in NDX (5th if we combine the two classes of Alphabet), and the largest in SOX – yet its performance over the past three years has been a veritable rollercoaster ride:
3-Year Chart, NVDA (red/green daily bars), NDX (blue line), SOX (purple line) – arrow used to highlight current NVDA price

Source: Interactive Brokers
On a morning like this, it is hard to be anything but optimistic about one of the market’s true winners. There will be plenty of time to wonder whether NVDA can continue to outperform its peers and benchmarks. For better or worse, the bar has been raised for future outperformance. But if AI remains a relative gold rush, it’s understandable why investors would want to put their money into the most profitable seller of the required equipment.
Join The Conversation
For specific platform feedback and suggestions, please submit it directly to our team using these instructions.
If you have an account-specific question or concern, please reach out to Client Services.
We encourage you to look through our FAQs before posting. Your question may already be covered!
Leave a Reply
Disclosure: Interactive Brokers
The analysis in this material is provided for information only and is not and should not be construed as an offer to sell or the solicitation of an offer to buy any security. To the extent that this material discusses general market activity, industry or sector trends or other broad-based economic or political conditions, it should not be construed as research or investment advice. To the extent that it includes references to specific securities, commodities, currencies, or other instruments, those references do not constitute a recommendation by IBKR to buy, sell or hold such investments. This material does not and is not intended to take into account the particular financial conditions, investment objectives or requirements of individual customers. Before acting on this material, you should consider whether it is suitable for your particular circumstances and, as necessary, seek professional advice.
The views and opinions expressed herein are those of the author and do not necessarily reflect the views of Interactive Brokers, its affiliates, or its employees.
Disclosure: Probability Lab
The projections or other information generated by the Probability Lab tool regarding the likelihood of various investment outcomes are hypothetical in nature, do not reflect actual investment results and are not guarantees of future results. Please note that results may vary with use of the tool over time.
Disclosure: Options Trading
Options involve risk and are not suitable for all investors. For information on the uses and risks of options, you can obtain a copy of the Options Clearing Corporation risk disclosure document titled Characteristics and Risks of Standardized Options by going to the following link ibkr.com/occ. Multiple leg strategies, including spreads, will incur multiple transaction costs.


How far can it run? Will gaps be filling