
- Solve real problems with our hands-on interface
- Progress from basic puts and calls to advanced strategies
Interactive Options Course
Posted July 29, 2026 at 2:38 am
Investopedia is partnering with All Star Charts on this newsletter. The contents of this newsletter are for informational and educational purposes only.
South Korea’s Kospi fell 10.8% overnight, its worst session in years.
The index closed at 6,023.66 after circuit breakers halted trading several times. Samsung Electronics dropped 13.4%, and SK Hynix fell 14.7%, with its recently listed US shares closing at $143, beneath the $149 IPO price. Japan’s Nikkei 225 fell 4% and Taiwan’s Taiex fell 4.7%. The selling carried into US chip names, and the VanEck Semiconductor ETF (SMH) opened roughly 4% lower.
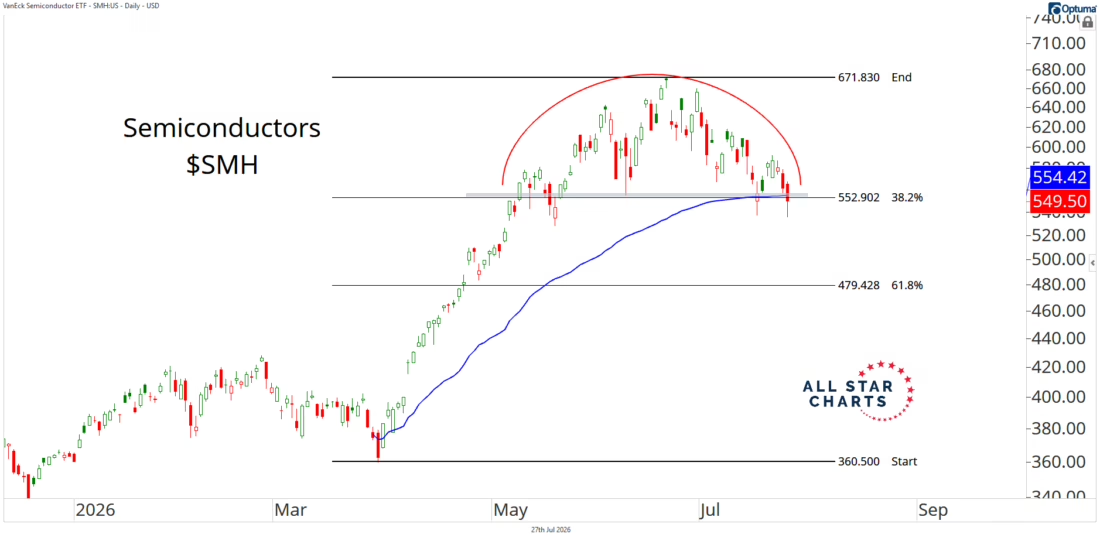
That move carried SMH through a price area we had been watching for weeks.
What sat at 550
A support level marks a price where buyers have previously stepped in. Most are identified by one method, which makes any single level a weak signal on its own.
A confluence zone is an area where several independent methods point at the same price, and three of them converged near 550 in SMH.
The first was the lower boundary of the range price had held since the second-quarter advance stalled. The second was the 38.2% Fibonacci retracement of that advance, measured from the March low near 360.50 to the June high of 671.83, which lands at 552.90. The third was the volume-weighted average price anchored to the March low, representing the average price paid by every buyer since the rally began.
Each is calculated differently and none depends on the others. That convergence is why a large number of participants were watching the same few points on the chart, and why a break through it registers as a change in character rather than ordinary volatility.
What broke it
The catalyst came from outside the chart entirely.
Technology outlet The Information reported that China has begun mass production of deep ultraviolet chipmaking tools, equipment central to manufacturing advanced semiconductors and long a bottleneck in China’s domestic capability. The report landed alongside the Shanghai debut of Chinese memory maker CXMT, which raised at least $8.6 billion and surged 466% on its first session.
Taken together, the two events suggested Chinese semiconductor capacity is advancing faster than consensus assumed, which is a direct threat to the pricing power underpinning the memory shortage that drove much of the sector’s 2026 gains.
SMH returned 82.1% in the first half of the year, according to S&P Global Market Intelligence, with much of that strength concentrated in memory names.
Why the selling may be overdone
DUV tools sit a generation behind the extreme ultraviolet equipment required for leading-edge production, and mass-producing equipment is a separate problem from matching yield, reliability, and customer qualification at scale. Announcing capacity and delivering competitive chips are years apart.
Chip cycles have also produced sharp drawdowns before that resolved higher, and the sector carries a documented tendency to underperform in the third quarter regardless of what shows up in the news.
There is a fair question about what the technical level accomplished here. It identified where positioning was concentrated. It said nothing about what would eventually break it, because the catalyst arrived from a trade publication in the middle of the night.
The general principle
Technical levels answer where, not why.
Confluence identifies the price at which the largest number of participants have reason to act, which is useful for knowing when conditions have changed and useless for predicting what will change them. The value in a break is speed of recognition rather than foresight.
For semiconductors, that recognition arrived this morning.
By the time The Information published, Korea had already closed limit-down and SMH was gapping through the level. Nobody positioned for this by reading about it at breakfast.
The work happens before the catalyst shows up, which means knowing which setups are wound tightest heading into their next event.
If you want to see how we’re trading it, that’s what the Beat Report is for. Take a look here.
—
Originally posted 28th July 2026
Investopedia.com: The comments, opinions and analyses expressed herein are for informational purposes only and should not be considered individual investment advice or recommendations to invest in any security or to adopt any investment strategy. While we believe the information provided herein is reliable, we do not warrant its accuracy or completeness. The views and strategies described on our content may not be suitable for all investors. Because market and economic conditions are subject to rapid change, all comments, opinions and analyses contained within our content are rendered as of the date of the posting and may change without notice. The material is not intended as a complete analysis of every material fact regarding any country, region, market, industry, investment or strategy. This information is intended for US residents only.
Information posted on IBKR Campus that is provided by third-parties does NOT constitute a recommendation that you should contract for the services of that third party. Third-party participants who contribute to IBKR Campus are independent of Interactive Brokers and Interactive Brokers does not make any representations or warranties concerning the services offered, their past or future performance, or the accuracy of the information provided by the third party. Past performance is no guarantee of future results.
This material is from Investopedia and is being posted with its permission. The views expressed in this material are solely those of the author and/or Investopedia and Interactive Brokers is not endorsing or recommending any investment or trading discussed in the material. This material is not and should not be construed as an offer to buy or sell any security. It should not be construed as research or investment advice or a recommendation to buy, sell or hold any security or commodity. This material does not and is not intended to take into account the particular financial conditions, investment objectives or requirements of individual customers. Before acting on this material, you should consider whether it is suitable for your particular circumstances and, as necessary, seek professional advice.
Any discussion or mention of an ETF is not to be construed as recommendation, promotion or solicitation. All investors should review and consider associated investment risks, charges and expenses of the investment company or fund prior to investing. Before acting on this material, you should consider whether it is suitable for your particular circumstances and, as necessary, seek professional advice.
Related Articles
















Join The Conversation
For specific platform feedback and suggestions, please submit it directly to our team using these instructions.
If you have an account-specific question or concern, please reach out to Client Services.
We encourage you to look through our FAQs before posting. Your question may already be covered!