
- Solve real problems with our hands-on interface
- Progress from basic puts and calls to advanced strategies
Interactive Options Course

Posted July 30, 2026 at 10:45 am
Investopedia is partnering with All Star Charts on this newsletter. The contents of this newsletter are for informational and educational purposes only.
Microsoft and Meta both raised spending last night, and the tape bought one while selling the other.
Amazon reports into that tonight, and its chart has been waiting more than a year for a catalyst like this one.
The stock closed at 230.86, roughly 10% below the level that decides everything at 254.626. Clearing that opens a measured objective of 361.626, which sits 57% above where it trades today, and the reason those numbers mean anything at all goes back three years.
Three years in the wilderness
Amazon topped at 188.50 in 2021 and then got taken apart, bottoming at 81.50 in late 2022 before spending the better part of three years carving out one of the cleanest rounded bottoms on the board. It finally broke out in 2024 and has printed higher highs and higher lows without exception since.
The floor it fought four times to win
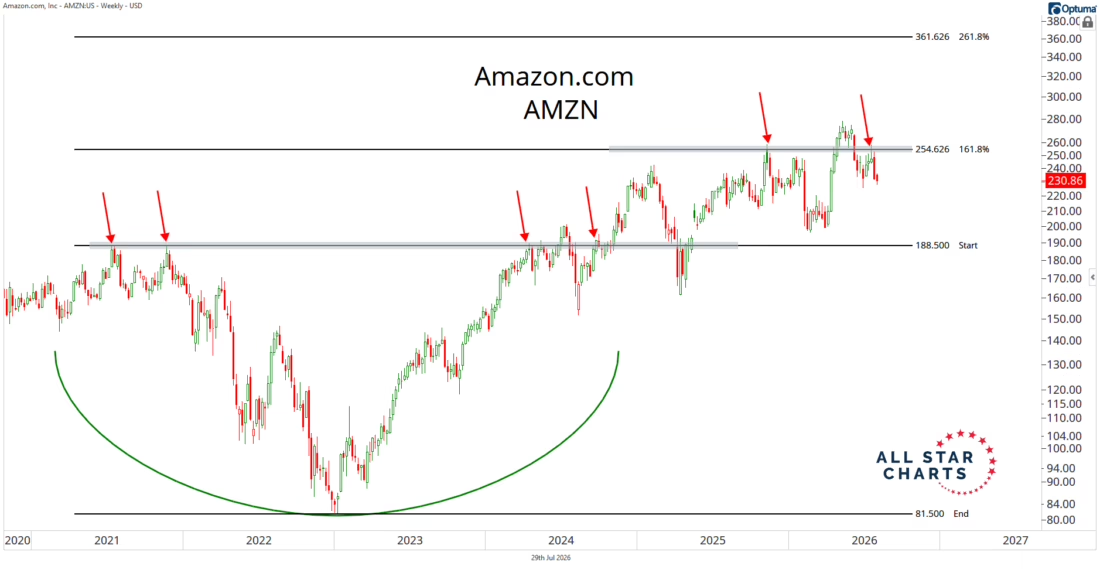
Pull up 188.50 on the weekly and count the rejections, because there were four of them, twice in 2021 and twice more across 2023 and 2024, before Amazon finally punched through and held above that price.
Technicians call that a polarity level, and it matters for a reason you can actually reason through rather than take on faith. Every seller who was right at 188.50 the first four times is now underwater and watching, so as long as price holds above it the structure stays intact and those sellers stay wrong.
The ceiling it hasn’t taken yet
The 254.626 level is the 161.8% Fibonacci extension of that entire base, measured from the 188.50 high down to the 81.50 low, and Amazon has been turned away there on two separate attempts.
An extension is a different animal from a retracement. A retracement measures how much of a finished move got handed back, while an extension projects how far price can travel past the old range once it escapes, using the same ratio sequence. Traders watch two of them, 161.8% and 261.8%, and the second one prints at 361.626 on this chart.
Above 254.626 the range breaks and 361 becomes the objective, while a third rejection leaves Amazon parked in territory it has occupied for over a year.
Now the honest part
Fibonacci ratios have no theoretical basis in finance whatsoever, since they describe growth patterns in nature and pointing them at a stock chart rests on observation rather than causation.
There’s a timing problem on top of that. A weekly level tells you nothing about how traders will read an AWS growth number that lands after the close, and the last three mega-cap reports have seen the catalyst run straight over the technicals.
The counterargument is narrower than it sounds, because nobody claims 254.626 predicts the reaction. It tells you what confirmation looks like once the reaction arrives, which is a smaller and considerably more useful thing to know.
We find out which side wins by about ten o’clock tomorrow morning.
Amazon and Apple both drop tonight, two of the heaviest weights in the index reporting into a tape that has already made examples out of three others this week.
Spencer will be at the desk trading the open while that level either breaks or holds.
—
Originally posted 30th July 2026
Investopedia.com: The comments, opinions and analyses expressed herein are for informational purposes only and should not be considered individual investment advice or recommendations to invest in any security or to adopt any investment strategy. While we believe the information provided herein is reliable, we do not warrant its accuracy or completeness. The views and strategies described on our content may not be suitable for all investors. Because market and economic conditions are subject to rapid change, all comments, opinions and analyses contained within our content are rendered as of the date of the posting and may change without notice. The material is not intended as a complete analysis of every material fact regarding any country, region, market, industry, investment or strategy. This information is intended for US residents only.
Information posted on IBKR Campus that is provided by third-parties does NOT constitute a recommendation that you should contract for the services of that third party. Third-party participants who contribute to IBKR Campus are independent of Interactive Brokers and Interactive Brokers does not make any representations or warranties concerning the services offered, their past or future performance, or the accuracy of the information provided by the third party. Past performance is no guarantee of future results.
This material is from Investopedia and is being posted with its permission. The views expressed in this material are solely those of the author and/or Investopedia and Interactive Brokers is not endorsing or recommending any investment or trading discussed in the material. This material is not and should not be construed as an offer to buy or sell any security. It should not be construed as research or investment advice or a recommendation to buy, sell or hold any security or commodity. This material does not and is not intended to take into account the particular financial conditions, investment objectives or requirements of individual customers. Before acting on this material, you should consider whether it is suitable for your particular circumstances and, as necessary, seek professional advice.
Related Articles

















Join The Conversation
For specific platform feedback and suggestions, please submit it directly to our team using these instructions.
If you have an account-specific question or concern, please reach out to Client Services.
We encourage you to look through our FAQs before posting. Your question may already be covered!