Short-term mean reversion trading on equity indexes is a popular trading style. Often, price-based technical indicators like RSI, CCI are used to assess if the stock market is in overbought or oversold conditions. A new research article written by Chainika Thakar and Rekhit Pachanekar explores a different indicator – TRIN, which compares the number of advancing and declining stocks to the advancing and declining volume. TRIN’s advantage is that it’s cross-sectionally based and its calculation uses not only price but also volume information. Thakar& Pachanekar’s research paper is useful for fans of indicators-based trading strategies and offers a short introduction to TRIN’s calculation together with an example of mean-reversion market timing strategy written in a python code.
Authors: Chainika Thakar, Rekhit Pachanekar
Title: Trading Index (TRIN) – Formula, Calculation & Strategy in Python
Link: https://blog.quantinsti.com/trin/
Abstract:
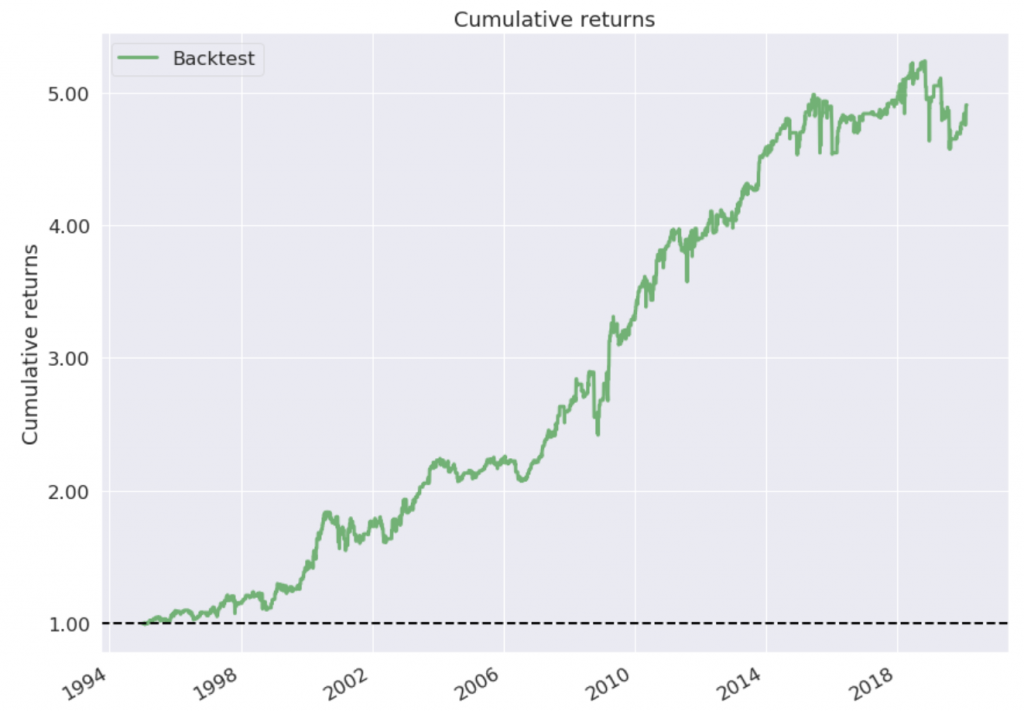
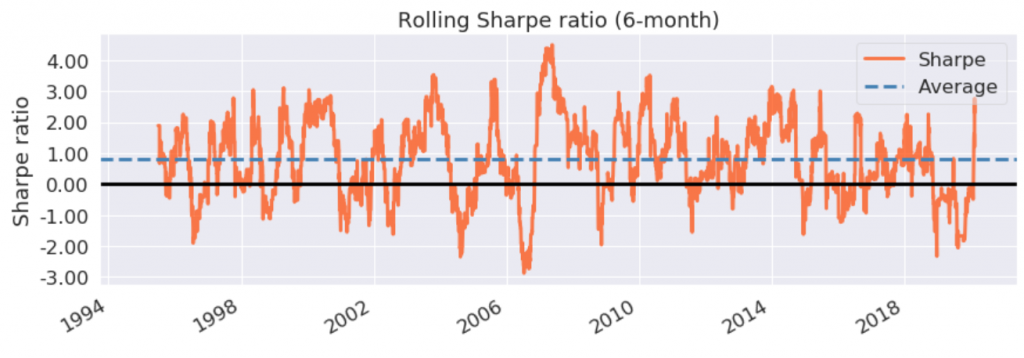
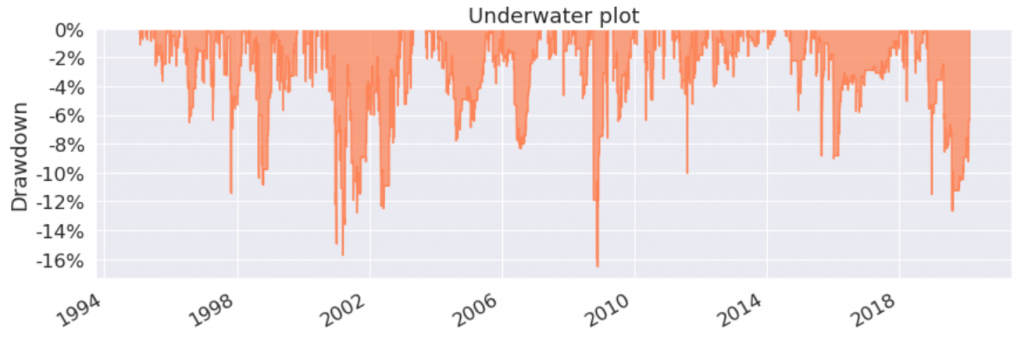
In order to assess the strength of the market, Richard W. Arms, Jr. invented the TRIN index in 1967, and it is used for measuring the relationship between market supply and demand. The TRIN index is successfully used to find out the market sentiment. Moreover, future price movements are indicated by TRIN since it generates overbought and oversold levels to find out when the price index may change direction. Based on the value of TRIN, a trader can find out if there is an upward or downward trend in the market and can make decisions to trade accordingly. TRIN can be calculated in Python in an efficient manner. We will use TRIN along with bollinger bands to create a trading strategy which generates signals of buy and sell according to the crossover of these indicators. We use the S&P500, DJI and NASDAQ-100 price data in this strategy and find that it generates a decent return with low maximum drawdowns. This will be beneficial for traders who prefer low risk.


Visit Quantpedia to learn more about this paper:
https://quantpedia.com/trading-index-trin-formula-calculation-trading-strategy-in-python/
Disclosure: Interactive Brokers Third Party
Information posted on IBKR Campus that is provided by third-parties does NOT constitute a recommendation that you should contract for the services of that third party. Third-party participants who contribute to IBKR Campus are independent of Interactive Brokers and Interactive Brokers does not make any representations or warranties concerning the services offered, their past or future performance, or the accuracy of the information provided by the third party. Past performance is no guarantee of future results.
This material is from Quantpedia and is being posted with its permission. The views expressed in this material are solely those of the author and/or Quantpedia and Interactive Brokers is not endorsing or recommending any investment or trading discussed in the material. This material is not and should not be construed as an offer to buy or sell any security. It should not be construed as research or investment advice or a recommendation to buy, sell or hold any security or commodity. This material does not and is not intended to take into account the particular financial conditions, investment objectives or requirements of individual customers. Before acting on this material, you should consider whether it is suitable for your particular circumstances and, as necessary, seek professional advice.


Join The Conversation
For specific platform feedback and suggestions, please submit it directly to our team using these instructions.
If you have an account-specific question or concern, please reach out to Client Services.
We encourage you to look through our FAQs before posting. Your question may already be covered!