On Nov 9, Pfizer reported that its COVID-19 vaccine had proven to be 90% effective in early testing. That day, beaten-down Value stocks like Carnival Cruise Lines (CCL) shot up and high-flying Momentum stocks like Zoom (ZM) got beaten down. Market participants seemed to think that the year’s divergence between these two groups was now overstated and that a return to normal was due.
The Value-Momentum rotation on the 9th was swift and violent. Below we plot the cumulative year to date returns for long/short portfolios (equally weighted within top/bottom deciles) formed using the Value and Momentum factors from our ExtractAlpha Risk Model to show the general anticorrelation of Value and Momentum this year along with the November 9 rotation – noting that there was a similar rotation back in early June.

There’s been another less well-known trend this year: the most innovative companies – those which are R&D intensive and with growing digital footprints – have outperformed significantly. We can quantify the innovation of these companies with two alternative datasets:
1. By using data on patents and work visas from ExtractAlpha’s ESGEvents Library
- ESGEvents Library is a cleaned, tickerized dataset of U.S. government filings, including company patent applications and grants from the USPTO as well as H1B and Permanent visa applications from the Department of Labor.
- We create an Innovation factor for thousands of U.S. stocks based on company- and industry-level engagement in IP activities and knowledge worker hiring.
2. By tracking growth in the company’s digital footprint, as captured in the Digital Revenue Signal (DRS)
- DRS scores thousands of companies globally each day on their online engagement across social media, web search, web traffic, and other metrics.
- DRS is predictive of both revenue surprises and earnings period returns.
Below, we create long-short, dollar neutral portfolios based on each of these factors, equally weighted and rebalancing daily (they are fairly low turnover, especially the Innovation factor, and for this purpose we ignore transaction costs). We restrict the universe here to liquid U.S. stocks. The 2020 year-to-date performance of these portfolios have been incredibly strong: approximately 25% for DRS and over 50% for Innovation.
Initially, we might think that the most innovative companies were the ones which experienced Momentum this year. But neither of the above innovation signals look like the Momentum lines we showed before, and interestingly, we didn’t see any corresponding crash in the innovation signals on Nov 9. This implies that we can separate Innovation from Momentum. This year, the companies which were most rewarded could be identified using these innovation-related metrics, and they were not punished when the market rotated away from Momentum.
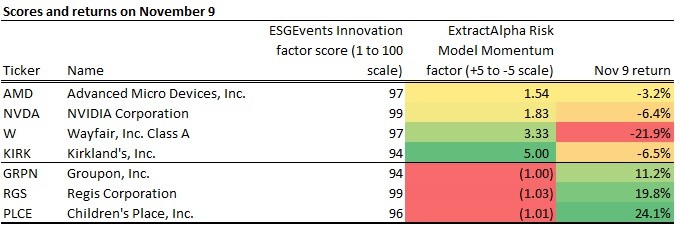
We can see from the following (admittedly anecdotal) examples of innovative companies that their returns on Nov 9 were driven by their Momentum exposure, and not how innovative they are:

- high-momentum innovative companies such as chip makers and online retailers erased their earlier gains
- low-momentum innovative companies which had been hit more by COVID-19 recovered

We view innovation and digital demand as new, alternative data-driven alphas or perhaps “alternative risk premia” in the coming years. These signals have some correlation to Momentum and Growth (and the inverse of Value), but clearly they capture something else, an underlying, diversifying factor and something which will be increasingly important in the years to come as technology continues to advance.
Visit ExtractAlpha to learn more about this research: https://extractalpha.com/2020/12/08/value-momentum-rotation-and-innovation
Disclosure: Interactive Brokers Third Party
Information posted on IBKR Campus that is provided by third-parties does NOT constitute a recommendation that you should contract for the services of that third party. Third-party participants who contribute to IBKR Campus are independent of Interactive Brokers and Interactive Brokers does not make any representations or warranties concerning the services offered, their past or future performance, or the accuracy of the information provided by the third party. Past performance is no guarantee of future results.
This material is from ExtractAlpha and is being posted with its permission. The views expressed in this material are solely those of the author and/or ExtractAlpha and Interactive Brokers is not endorsing or recommending any investment or trading discussed in the material. This material is not and should not be construed as an offer to buy or sell any security. It should not be construed as research or investment advice or a recommendation to buy, sell or hold any security or commodity. This material does not and is not intended to take into account the particular financial conditions, investment objectives or requirements of individual customers. Before acting on this material, you should consider whether it is suitable for your particular circumstances and, as necessary, seek professional advice.


Join The Conversation
For specific platform feedback and suggestions, please submit it directly to our team using these instructions.
If you have an account-specific question or concern, please reach out to Client Services.
We encourage you to look through our FAQs before posting. Your question may already be covered!