
- Solve real problems with our hands-on interface
- Progress from basic puts and calls to advanced strategies
Interactive Options Course
Posted November 26, 2019 at 9:53 am
In Part IV and Part V Jonathan created a chart and showed how to wrap that chart in a call to ggplotly() . The required packages and data preparation scripts are available in Part I, and Part II of this series. In Part III Jonathan worked with data for MACK and FWP dividends.
Let’s add back the name and sector data by left_join()ing our wrangled data object.
nasdaq_dividends %>%
  left_join(nasdaq_wrangled, by = "symbol") %>%
  head()
# A tibble: 6 x 9
symbol date dividends company last_sale_price market_cap ipo_year
<chr> <date> <dbl> <chr> <dbl> <dbl> <dbl>
1 AVGO 2010-12-13 0.07 Broadc… 272. 108330 2009
2 AVGO 2011-03-16 0.08 Broadc… 272. 108330 2009
3 AVGO 2011-06-15 0.09 Broadc… 272. 108330 2009
4 AVGO 2011-09-15 0.11 Broadc… 272. 108330 2009
5 AVGO 2011-12-15 0.12 Broadc… 272. 108330 2009
6 AVGO 2012-03-15 0.13 Broadc… 272. 108330 2009
# … with 2 more variables: sector <chr>, industry <chr>Once the company name data is joined, we can incorporate into the plot by adding label_tooltip = company to ggplot(aes(...)) and then setting tooltip = "label_tooltip", to alert plotly about the new tooltip data.
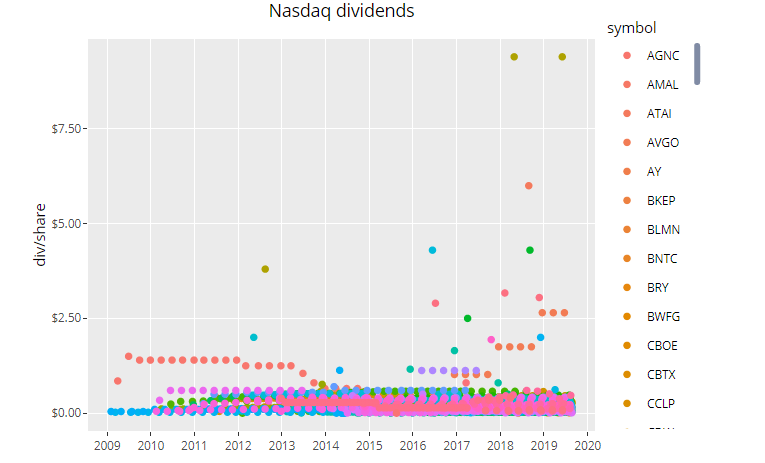
Visit the blog to download the R code or to explore the interactive version of the above chart: https://www.reproduciblefinance.com/2019/08/25/tech-dividends/
ggplotly(
nasdaq_dividends %>%
  filter(symbol != "MACK" & symbol != "FWP") %>%
  left_join(nasdaq_wrangled, by = "symbol") %>%
  group_by(symbol) %>%
  ggplot(aes(x = date, y = dividends, color = symbol, label_tooltip = company)) +
  geom_point() +
  scale_y_continuous(labels = scales::dollar)  +
  scale_x_date(breaks = scales::pretty_breaks(n = 10)) +
  labs(x = "", y = "div/share", title = "Nasdaq dividends") +
  theme(plot.title = element_text(hjust = 0.5)),
tooltip = "label_tooltip"
)
In the next installment of this series, Jonathan use mutate to create a new column that holds our label information.
Any stock, options or futures symbols displayed are for illustrative purposes only and are not intended to portray recommendations.
Information posted on IBKR Campus that is provided by third-parties does NOT constitute a recommendation that you should contract for the services of that third party. Third-party participants who contribute to IBKR Campus are independent of Interactive Brokers and Interactive Brokers does not make any representations or warranties concerning the services offered, their past or future performance, or the accuracy of the information provided by the third party. Past performance is no guarantee of future results.
This material is from Reproducible Finance and is being posted with its permission. The views expressed in this material are solely those of the author and/or Reproducible Finance and Interactive Brokers is not endorsing or recommending any investment or trading discussed in the material. This material is not and should not be construed as an offer to buy or sell any security. It should not be construed as research or investment advice or a recommendation to buy, sell or hold any security or commodity. This material does not and is not intended to take into account the particular financial conditions, investment objectives or requirements of individual customers. Before acting on this material, you should consider whether it is suitable for your particular circumstances and, as necessary, seek professional advice.


Join The Conversation
For specific platform feedback and suggestions, please submit it directly to our team using these instructions.
If you have an account-specific question or concern, please reach out to Client Services.
We encourage you to look through our FAQs before posting. Your question may already be covered!