In Part I of this week’s commentary, we will feature Value-Momentum convergence play. Part II will focus on the heatmaps.
Value-Momentum convergence play?
- Our August 26th (2019) weekly Smart Beta Book concluded rather presciently with, “Finally, it’s important to put these YTD moves in the context of their longer term LTD history since the 3 worst ESBs at present (RV, DV, Size) are also the Top 3 best ESBs LTD (since Jan 2000) suggesting a significant opportunity when these factors revert back to their LT means.” From Aug 28th – Sept 16th Deep Value came screaming back ~+24% while PMOM crashed ~-23% vindicating that call.
- On Feb 3rd (2020), we noted that our Value was “starting to look oversold” & that “contrary to the oft observed January effect there were no reversals in sight as 2019 trends remained intact.” We also observed that based on bottom up aggregate ranks, Tech was looking rather stretched while Energy was oversold on technicals.
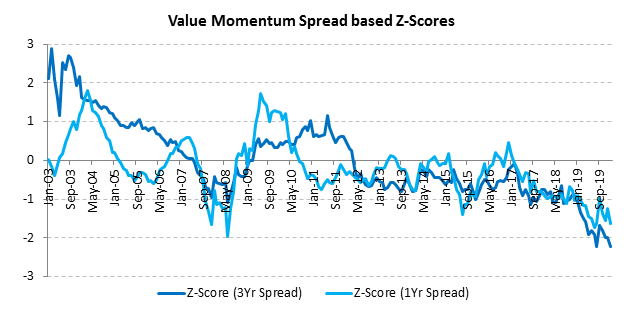
Needless to say “we witnessed a major Val-Mo rotation on Feb 5th with Value & Reversals up as much as +4% driven by the bounce in Energy vs PMOM & Risk down ~-2% ($ neutral) as the growthy tech names sold off” immediately following our note. - On Feb 10th (2020), we presented “our rationale behind a potential Value-Momentum rotation” based on the “underperformance of Value over the last 3 years which has resulted in Value factor becoming “cheaper””. Indeed Value-Momentum spreads are historically wide as indicated in the below graph with the 1Yr and 3Yr spread Z-scores at -1.6 and -2.2 respectively. In fact the spread exceeded 20% within the first 6 weeks of the year. N.B. – These Z-scores are with respect to the full 20+ year history of the spread returns in our database.

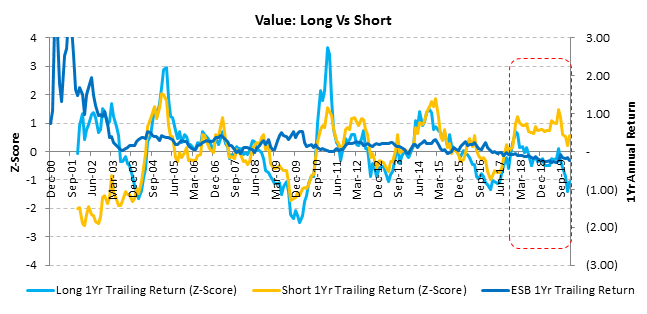
- There is a huge dispersion in the valuation spread of the Value factor itself, as apparent from the graph below. In general, the valuation spread between defensive (low vol) + growth/ momentum vs cyclical names has (by some measures) exceeded the outlandish levels attained during the Nasdaq bubble (as emblematic in Tech vs Energy). Key catalyst for Value remains the steepness of the curve for Financials & Cyclicals to ignite. Additionally, Energy being in doldrums has been detrimental to Value on the long side but was a part of the reversal story last week. As the valuation gap amongst Value Longs vs Shorts narrows we should expect to see the Value factor outperform on an EMN basis (either because the multiples on the long side revert to the mean or more likely those on the short side compress).

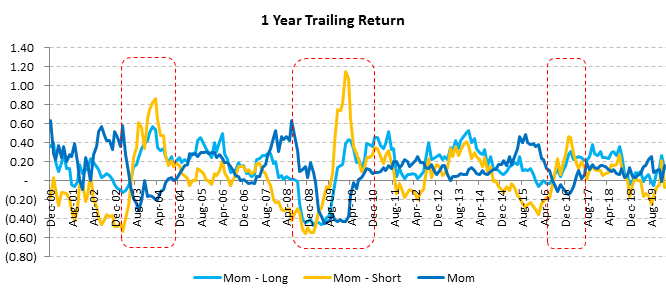
- Historically, the largest momentum crashes have been precipitated by short squeezes at market inflection points (e.g., in the aftermath of the Nasdaq & 2008 crashes), whereas, we are now potentially looking at the exact opposite viz., a situation where the overbought Longs may actually lead the factor selloff in EMN terms.

- With Covid-19 rapidly spreading across Italy this weekend not to mention the series of infections in Japan & Korea, markets are likely to remain under pressure near term as they start pricing in a global (not just Asian) slowdown. Many small businesses in China & HK are likely to suffer or shutter while simultaneously squeezing the global supply chain. It became clear this weekend that the West is not immune to the contagion & that we may be looking at a global pandemic which is far from priced in given that US equities have been making new highs lately. The selloff last week led by the growth/ momentum complex could therefore continue (barring further central bank stimulus) which is one leg of our Val-Mo convergence call.
- The negative market contagion and uncertainty emanating from Covid-19 remains the chief risk to our factor rotation thesis. However, this will likely be counter-balanced by another wave of fiscal & monetary stimulus worldwide which would be the catalyst for Value & cyclicals to rebound significantly at the expense of overpriced bond proxies (aka the Low Vol bubble).
- It’s no surprise that markets have been inured to risks by the omnipresent global coordinated central bank puts. Episodic spikes in vol & dispersion are usually quite favorable for EMN factor investing although not necessarily on the long side (unless one happens to be positioned in the right factors). Stay tuned for more.
Disclosure: QMIT – QuantZ Machine Intelligence Technologies
QMIT is a data provider and not an investment advisor. This information has been prepared by QMIT for informational purposes only. This information should not be construed as investment, legal and/or tax advice. Additionally, this content is not intended as an offer to sell or a solicitation of any investment product or service. Opinions expressed are based on statistical forecasting from historical data. Past performance does not guarantee future performance. Further, the assumptions and the historical data based used could be erroneous. All results and analyses expressed are merely hypothetical and are NOT guaranteed. Trading securities involves substantial risk. Please consult a qualified investment advisor before risking any capital. The performance results for live portfolios following the screens presented herein may differ from the performance hypotheticals contained in this report for a variety of reasons, including differences related to transaction costs, market impact, fees, as well as differences in the time and price of execution. The performance results for individuals following the strategy could also differ based on differences in treatment of dividends received, including the amount received and whether and when such dividends were reinvested. We do not request personal information in any unsolicited email correspondence from our customers. Any correspondence offering trading advice or unsolicited message asking for personal details should be treated as fraudulent and reported to QMIT. Neither QMIT nor its third-party content providers shall be liable for any errors, inaccuracies or delays in content, or for any actions taken in reliance thereon. QMIT EXPRESSLY DISCLAIMS ALL WARRANTIES, EXPRESSED OR IMPLIED, AS TO THE ACCURACY OF ANY THE CONTENT PROVIDED, OR AS TO THE FITNESS OF THE INFORMATION FOR ANY PURPOSE. Although QMIT makes reasonable efforts to obtain reliable content from third parties, QMIT does not guarantee the accuracy of or endorse the views or opinions given by any third-party content provider. All content herein is owned by QuantZ Machine Intelligence Technologies and/ or its affiliates and protected by United States and international copyright laws. QMIT content may not be reproduced, transmitted or distributed without the prior written consent of QMIT.
Disclosure: Interactive Brokers Third Party
Information posted on IBKR Campus that is provided by third-parties does NOT constitute a recommendation that you should contract for the services of that third party. Third-party participants who contribute to IBKR Campus are independent of Interactive Brokers and Interactive Brokers does not make any representations or warranties concerning the services offered, their past or future performance, or the accuracy of the information provided by the third party. Past performance is no guarantee of future results.
This material is from QMIT – QuantZ Machine Intelligence Technologies and is being posted with its permission. The views expressed in this material are solely those of the author and/or QMIT – QuantZ Machine Intelligence Technologies and Interactive Brokers is not endorsing or recommending any investment or trading discussed in the material. This material is not and should not be construed as an offer to buy or sell any security. It should not be construed as research or investment advice or a recommendation to buy, sell or hold any security or commodity. This material does not and is not intended to take into account the particular financial conditions, investment objectives or requirements of individual customers. Before acting on this material, you should consider whether it is suitable for your particular circumstances and, as necessary, seek professional advice.


Join The Conversation
For specific platform feedback and suggestions, please submit it directly to our team using these instructions.
If you have an account-specific question or concern, please reach out to Client Services.
We encourage you to look through our FAQs before posting. Your question may already be covered!