Get up-to-speed with RSI Indicator with the tutorial in Part IV.
RSI and MACD strategy
We have long understood that using a sole indicator as the basis for your trading decisions can be disastrous if we fail to read or there is a false signal generated by the indicator. The smart investor uses 2 or more indicators to identify a positive (or negative) signal and enters the market accordingly. With this factor, we use RSI and MACD to identify signals which can be used to trade profitably. To understand MACD and how to calculate it, you can refer to this article.
Why do we use RSI and MACD indicators together?
The reason we use RSI and MACD together is they complement each other due to their inherent nature of comparing the price action of an asset.
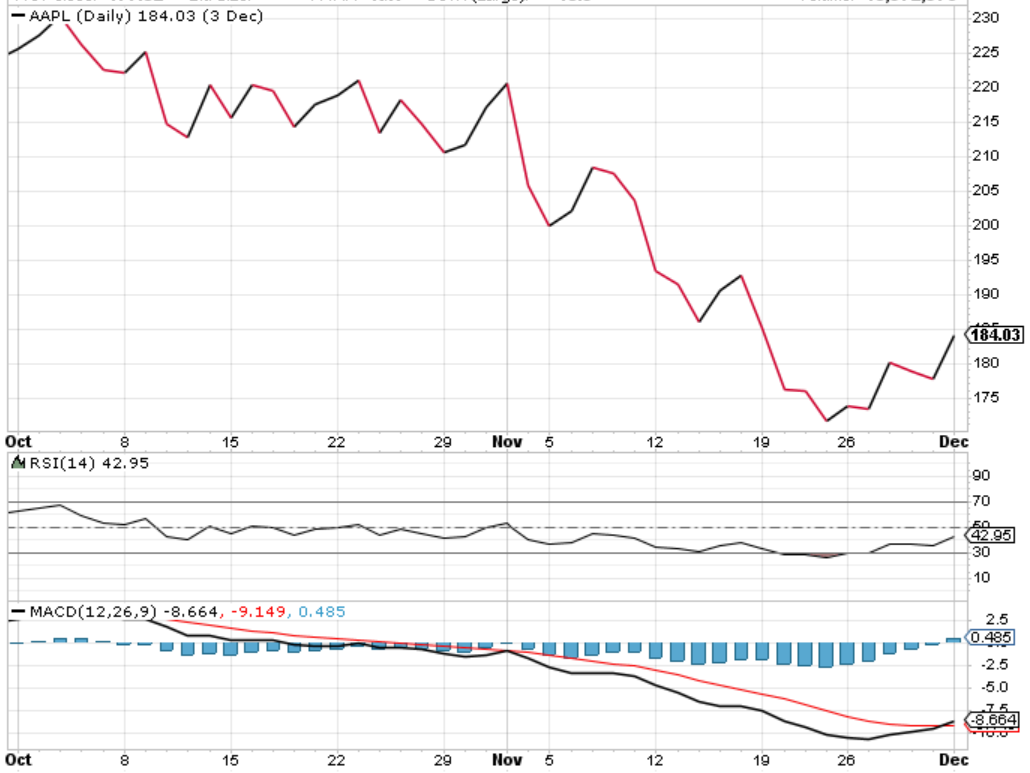
In this strategy, we enter the trade when both the RSI and MACD indicate that the asset is oversold and exit when either of the indicators gives us a signal that the price has entered the overbought zone.

You can see in the graph above that the MACD crossed below the centre line indicating a downtrend, but we would wait till Nov 2018 when the RSI breaches the 70 barriers but drops sharply afterwards. Here we have two indicators possibly telling us that the market is headed towards a bear run and sure enough, we can see that the closing price keeps declining till the end of November 2018. Thus we can go short on the stock in November and since we saw that the RSI indicator goes below 30 before rising again, we can exit the position.
Difference between RSI indicator and MACD indicator
While we did mention that RSI indicators and MACD indicators have certain similarities, they have a different approach towards it. While RSI indicators consider the ratio of the gains and losses compared to the previous day, MACD is essentially a moving average of the price.
Thus, we should be careful and not expect that both the RSI and MACD will give the same signal at a particular point in time.
Limitations of RSI
- The fundamental property of RSI which states that a level above 70 is overbought can be proved wrong in a strong bull market where the company is progressing rapidly and posting good returns to its shareholders In this scenario the RSI can stay above 70 for a long time, which can be disastrous for short sellers. It is a similar case for a bear market where the RSI can stay below 30 and not rise above that level for an extended period of time.
- The RSI can give false signals too. There are times when a divergence is indicated but the stock continues in its trend.
Thus, it is always said that we should use the RSI with one or more indicators which will give us a holistic view of the market and help us extract maximum information from the price action of a particular asset.

Visit QuantInsti to download additional code:
https://blog.quantinsti.com/rsi-indicator/
Disclosure: Interactive Brokers Third Party
Information posted on IBKR Campus that is provided by third-parties does NOT constitute a recommendation that you should contract for the services of that third party. Third-party participants who contribute to IBKR Campus are independent of Interactive Brokers and Interactive Brokers does not make any representations or warranties concerning the services offered, their past or future performance, or the accuracy of the information provided by the third party. Past performance is no guarantee of future results.
This material is from QuantInsti and is being posted with its permission. The views expressed in this material are solely those of the author and/or QuantInsti and Interactive Brokers is not endorsing or recommending any investment or trading discussed in the material. This material is not and should not be construed as an offer to buy or sell any security. It should not be construed as research or investment advice or a recommendation to buy, sell or hold any security or commodity. This material does not and is not intended to take into account the particular financial conditions, investment objectives or requirements of individual customers. Before acting on this material, you should consider whether it is suitable for your particular circumstances and, as necessary, seek professional advice.


Join The Conversation
For specific platform feedback and suggestions, please submit it directly to our team using these instructions.
If you have an account-specific question or concern, please reach out to Client Services.
We encourage you to look through our FAQs before posting. Your question may already be covered!