To learn more about QuantZ/ QMIT and to get our factor research + heatmaps daily or even real-time, please get in touch!
The factor landscape YTD after the sell off
The market had been whistling past the graveyard as
Armageddon swept across China. We said last week that, “with Covid-19 rapidly
spreading across Italy this weekend not to mention the series of infections in
Japan & Korea, markets are likely to remain under pressure” before the
swiftest six-day correction in the history of US markets. It’s
no surprise that China’s draconian quarantining measures have led to an
unprecedented crash in both the manufacturing and non-manufacturing PMIs there
(February). However, with Covid 19 already in 65 countries & the 1st
confirmed case just reported in NYC not to mention 6 deaths in WA state, it’s
clear that all such measures might not contain this contagion (literally &
figuratively). The fact is that it’s likely to spread just like the common
cold/ flu across the world eventually exposing everyone since the transmission
is airborne. Down the road it may become a permanent seasonal fixture along
with the various strains of influenza that we inoculate against each flu season
once there is a vaccine. Not enough is known about the disease propagation
yet but we do know that the Ro (2-2.4 transmission rate) is high (https://www.facebook.com/teppercmu/videos/223086638736293/
The seven day (20th Feb – 28th Feb) -13% haircut to the SPX qualifies as the fastest correction in history.
However, it was an orderly decline without the usual histrionics caused by
liquidity holes, flash crashes, margin calls and systemic outages a la 2008
(those are likely still to come like the Robinhood outages). As anticipated by
the Fed fund futures market we got the 50bps emergency rate cut by the Fed
today. We expect global coordinated rate cuts to follow even though with so
many rates in negative territory, central bankers are mostly out of ammunition
unless they resort to non-traditional monetary stimulus. While timely, these
measures cannot revive patients or economic activity unless we get past the
curtailment of public activities, travel & quarantining once there’s a
realization that the spread can be slowed but not easily stopped. Demand
destruction of this nature cannot be fixed by rate cuts nor can it
restore the supply chain disruptions. That realization alone could
bring the buy every dip mentality to a halt. Indeed, the markets negative reaction
to the cuts intraday would suggest that the Fed may have wasted precious little
ammunition left (caving into political pressure) while this Administration
squanders every opportunity towards constructive preparedness down in the
trenches.
It remains to be seen if this movie has a
macabre ending like that of the Spanish Flu of 1918 or a more benign denouement
like that of SARS which died out once the virus mutated & people distanced
themselves from civet cats – the proximate source. Best to keep an eye on the
latest data from the WHO here: https://github.com/CSSEGISandData/COVID-19
The bottom line is that the extreme measures
being taken by countries in terms of school closures, cancellation of events/
conferences, curtailment of travel etc is likely to plunge the global economy
into a recession just as we saw with the abysmal Chinese PMIs. 10y yields
plummeting to historic lows (0.98% intraday) may already be pricing in a
global recession with the global PMI heading south of 50. It may also
boost the bond proxies further & lead to an even greater blow off top in
such factors as Risk (Low Vol). The related “Bernie” factor is also getting
priced in which may explain why Healthcare has not held up better vs Biotechs –
Super Tuesday shall tell. The looming recessionary prospects & uncertain spread
of Covid 19 present obvious challenges to any factor prognostications hence
let’s focus on taking stock of what happened in Feb, YTD and where that might
take us next
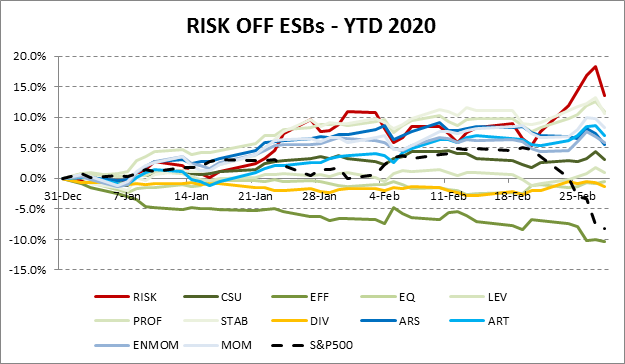
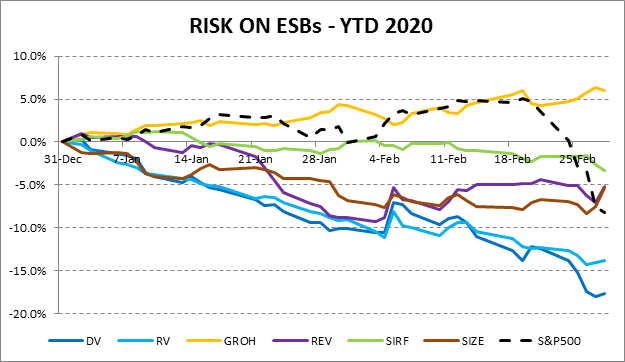
- 1st we look at all ESBs YTD and then within Feb we compare the two sub-periods, pre-19th Feb and post-19th Feb. All analysis is based on the dollar-neutral daily re-balancing of factor re-ranks where the ESB’s factor allocations are still optimized at the prior month end. NB – we present below beta-neutral as well as monthly re-balanced versions.
- We categorize our 18 ESBs into those that broadly fall into Risk Off (Defensive) vs Risk On (Offensive) factors based on a study to be published with the regime mapping.
- YTD factor performance already had a pretty defensive tilt to it despite the solid start to the year for stocks up until the 2/20 correction began. To wit, only Growth was up YTD amongst the Risk On ESBs while on the Risk Off side most of our ESBs were up YTD (except for Dividends & Efficiency).
- During the 7d
sell-off, Defensive ESBs outperformed in line with intuition.
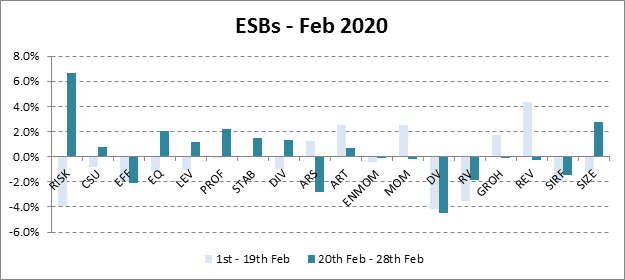
- Quality ESBs were up nicely (CSU +0.8%, EQ 2.0%, LEV 1.1%, PROF 2.2% and STAB 1.5%).
- Risk (aka Low Vol) was up +6.7% on a Dollar-Neutral basis.
- Feb was a tale of two-halves with pre-19th Feb and post-19th Feb moves cancelling out in cases like that of Dividends, Leverage & CSU.
- Value ESBs (DV & RV) continued their steady march downwards as a continuation of last year due to yields hitting all-time lows anddespite the curve steepening. The failure of Value is a much more nuanced story due to the parallel shift down in conjunction with the curve steepening because key constituent sectors like Energy continued hemorrhaging.
- Nearly all Risk On ESBs including SIRF, Size & Value (except Growth) continued their steady march downwards in Feb.
- Momentum ESBs (MOM, ENMOM, ARS) underperformed while ART worked for the full mo after netting out the two-halves.
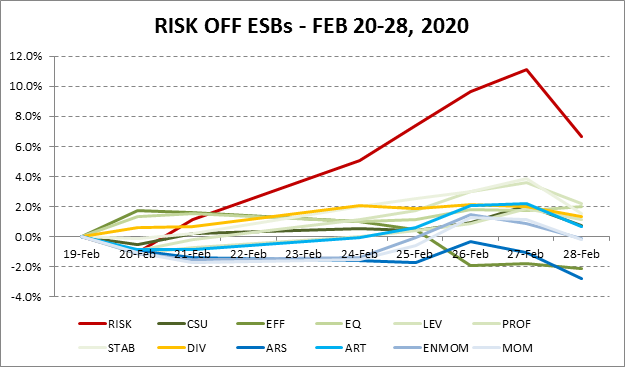
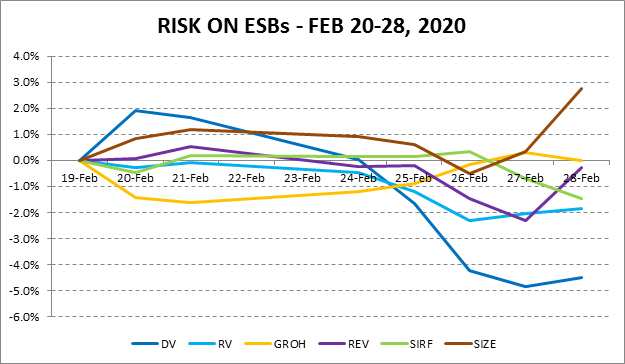
Factor leadership started to change (as we’d expected) but only in the last two days – it remains to be seen if this is indeed the inflection point we were expecting given that we saw Risk sell off last Fri in favor of Value while Reversals kicked in. All we can be sure of is that there is much more factor vol to come before the dust settles and clearer patterns emerge as markets may well retest the lows despite the oversold bounce of Monday 3/2/20.
To learn more about QuantZ/ QMIT and to get our factor research + heatmaps daily or even real-time, please get in touch!
Disclosure: QMIT – QuantZ Machine Intelligence Technologies
QMIT is a data provider and not an investment advisor. This information has been prepared by QMIT for informational purposes only. This information should not be construed as investment, legal and/or tax advice. Additionally, this content is not intended as an offer to sell or a solicitation of any investment product or service. Opinions expressed are based on statistical forecasting from historical data. Past performance does not guarantee future performance. Further, the assumptions and the historical data based used could be erroneous. All results and analyses expressed are merely hypothetical and are NOT guaranteed. Trading securities involves substantial risk. Please consult a qualified investment advisor before risking any capital. The performance results for live portfolios following the screens presented herein may differ from the performance hypotheticals contained in this report for a variety of reasons, including differences related to transaction costs, market impact, fees, as well as differences in the time and price of execution. The performance results for individuals following the strategy could also differ based on differences in treatment of dividends received, including the amount received and whether and when such dividends were reinvested. We do not request personal information in any unsolicited email correspondence from our customers. Any correspondence offering trading advice or unsolicited message asking for personal details should be treated as fraudulent and reported to QMIT. Neither QMIT nor its third-party content providers shall be liable for any errors, inaccuracies or delays in content, or for any actions taken in reliance thereon. QMIT EXPRESSLY DISCLAIMS ALL WARRANTIES, EXPRESSED OR IMPLIED, AS TO THE ACCURACY OF ANY THE CONTENT PROVIDED, OR AS TO THE FITNESS OF THE INFORMATION FOR ANY PURPOSE. Although QMIT makes reasonable efforts to obtain reliable content from third parties, QMIT does not guarantee the accuracy of or endorse the views or opinions given by any third-party content provider. All content herein is owned by QuantZ Machine Intelligence Technologies and/ or its affiliates and protected by United States and international copyright laws. QMIT content may not be reproduced, transmitted or distributed without the prior written consent of QMIT.
Disclosure: Interactive Brokers Third Party
Information posted on IBKR Campus that is provided by third-parties does NOT constitute a recommendation that you should contract for the services of that third party. Third-party participants who contribute to IBKR Campus are independent of Interactive Brokers and Interactive Brokers does not make any representations or warranties concerning the services offered, their past or future performance, or the accuracy of the information provided by the third party. Past performance is no guarantee of future results.
This material is from QMIT – QuantZ Machine Intelligence Technologies and is being posted with its permission. The views expressed in this material are solely those of the author and/or QMIT – QuantZ Machine Intelligence Technologies and Interactive Brokers is not endorsing or recommending any investment or trading discussed in the material. This material is not and should not be construed as an offer to buy or sell any security. It should not be construed as research or investment advice or a recommendation to buy, sell or hold any security or commodity. This material does not and is not intended to take into account the particular financial conditions, investment objectives or requirements of individual customers. Before acting on this material, you should consider whether it is suitable for your particular circumstances and, as necessary, seek professional advice.







Join The Conversation
For specific platform feedback and suggestions, please submit it directly to our team using these instructions.
If you have an account-specific question or concern, please reach out to Client Services.
We encourage you to look through our FAQs before posting. Your question may already be covered!