This morning has been unfriendly to equity investors. The troubles started yesterday after two poorly received Treasury auctions. Neither the 2-year nor the 5-year was considered successful. Those combined to deflate an otherwise buoyant stock market, though Nvidia’s (NVDA) 7% rally kept the S&P 500 (SPX) and Nasdaq 100 (NDX) in the green. So far today, that’s not helping.
We are writing this ahead of today’s 7-year auction, but rates across the curve are higher in anticipation. Those higher rates, along with a rare flattish day from NVDA, are combining to give us more broad-based selling that started in the pre-market and has persisted so far. It is entirely possible that the premise of this piece will be turned upside down by the time you read this – bond traders may have priced in sufficient risk aversion to allow a successful auction. If not, please read on…
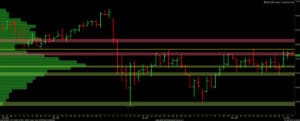
Bond yields and stock prices are related, but the relationship is flexible. Much of it depends on circumstances. Bearing in mind that bond yields rise when prices fall, we see that this year’s rally has come in spite of higher yields:
6-Months, 10-Year Treasury Futures (red/green candles), SPX (blue)

Source: Interactive Brokers
For most of the year this has not been a problem. The initial rationale for rising yields was because there was a sea change about the prospects for the economy. As early as December we began to question whether markets had priced in an impossible conundrum by somehow simultaneously pricing in 6-7 rate cuts amidst an economic backdrop that allowed for solid earnings growth. The economy pulled its weight, allowing stock investors to focus on earnings rather than the potential for rate cuts. Thus, as those expectations fell away, stocks were able to continue to rise along with rates.
But that relationship began to unravel over the past few weeks. Futures markets solidified their expectations around 1-2 rate cuts for 2024, yet we still saw bond prices fall and stock prices far outpace them. This is evident when we shrink the timeframe of the above chart to 3 months:
3-Months, 10-Year Treasury Futures (red/green candles), SPX (blue)

Source: Interactive Brokers
Notice how SPX roughly followed bond prices throughout March and April but far outpaced them this month. Bearing in mind that rate cut expectations have been largely set since the April swoon in stocks, the divergence is more about prospects for equities alone – pushed ahead by multiple expansion and momentum – than the relationship between stocks and bonds. For the past few days, starting with Thursday’s key reversal in stocks, the two investment classes have begun to re-establish their relationship to the detriment of equities.
There are two key items to watch today. First is whether the bond market has suppressed its expectations to the point where the 7-year auction can surpass them. Second is whether SPX can hold above Thursday’s low of 5256.93. A dip below that level would confirm the outside reversal, potentially setting up more downside for stocks. If it can manage to hold above that low, as it has done so far today, then stocks can continue to hold their footing – at least in the short-term.
Join The Conversation
For specific platform feedback and suggestions, please submit it directly to our team using these instructions.
If you have an account-specific question or concern, please reach out to Client Services.
We encourage you to look through our FAQs before posting. Your question may already be covered!
Leave a Reply
Disclosure: Interactive Brokers
The analysis in this material is provided for information only and is not and should not be construed as an offer to sell or the solicitation of an offer to buy any security. To the extent that this material discusses general market activity, industry or sector trends or other broad-based economic or political conditions, it should not be construed as research or investment advice. To the extent that it includes references to specific securities, commodities, currencies, or other instruments, those references do not constitute a recommendation by IBKR to buy, sell or hold such investments. This material does not and is not intended to take into account the particular financial conditions, investment objectives or requirements of individual customers. Before acting on this material, you should consider whether it is suitable for your particular circumstances and, as necessary, seek professional advice.
The views and opinions expressed herein are those of the author and do not necessarily reflect the views of Interactive Brokers, its affiliates, or its employees.


good article. i think the relationship between the 70 trillion stock market and the 30 trillion bond market is the same as the husband to the wife. we know who the boss really is. or just go to the rules of chess. the stock market is the king. the bond market is the queen.
You left bank savings rate out of the mix. 4,50% is hard to pass up.
Always pertinent commentary. You are clear, timely and valuable. This column is great!
We hope you continue to enjoy Traders’ Insight!
short term 5 with a good nights sleep is always something worth considering