See Part I and Part II to get insight on Supervised Learning.
Types of Classification
Based on the number and level of classes present in the dataset, there are three types of classification.
Binary Classification
This type of classification has only two categories. Usually, they are boolean values – 1 or 0, True or False, High or Low. Some examples where such a classification could be used is in cancer detection or email spam detection where the labels would be positive or negative for cancer and spam or not spam for spam detection.
Let us take an example. We are using a breast cancer detection dataset that can be downloaded from here.
import pandas as pd
import numpy as np
import matplotlib.pyplot as plt
import seaborn as sns
data= pd.read_csv(“data.csv”)
data.head()
read_data_for_classification.py hosted with ❤ by GitHub
| id | diagnosis | radius_mean | texture_mean | perimeter_mean | area_mean | smoothness_mean | compactness_mean | concavity_mean | concave points_mean | symmetry_mean | fractal_dimension_mean | radius_se | texture_se | perimeter_se | area_se | smoothness_se | compactness_se | concavity_se | concave points_se | symmetry_se | fractal_dimension_se | radius_worst | texture_worst | perimeter_worst | area_worst | smoothness_worst | compactness_worst | concavity_worst | concave points_worst | symmetry_worst | fractal_dimension_worst | |
| 0 | 842302 | M | 17.99 | 10.38 | 122.80 | 1001.0 | 0.11840 | 0.27760 | 0.3001 | 0.14710 | 0.2419 | 0.07871 | 1.0950 | 0.9053 | 8.589 | 153.40 | 0.006399 | 0.04904 | 0.05373 | 0.01587 | 0.03003 | 0.006193 | 25.38 | 17.33 | 184.60 | 2019.0 | 0.1622 | 0.6656 | 0.7119 | 0.2654 | 0.4601 | 0.11890 |
| 1 | 842517 | M | 20.57 | 17.77 | 132.90 | 1326.0 | 0.08474 | 0.07864 | 0.0869 | 0.07017 | 0.1812 | 0.05667 | 0.5435 | 0.7339 | 3.398 | 74.08 | 0.005225 | 0.01308 | 0.01860 | 0.01340 | 0.01389 | 0.003532 | 24.99 | 23.41 | 158.80 | 1956.0 | 0.1238 | 0.1866 | 0.2416 | 0.1860 | 0.2750 | 0.08902 |
| 2 | 84300903 | M | 19.69 | 21.25 | 130.00 | 1203.0 | 0.10960 | 0.15990 | 0.1974 | 0.12790 | 0.2069 | 0.05999 | 0.7456 | 0.7869 | 4.585 | 94.03 | 0.006150 | 0.04006 | 0.03832 | 0.02058 | 0.02250 | 0.004571 | 23.57 | 25.53 | 152.50 | 1709.0 | 0.1444 | 0.4245 | 0.4504 | 0.2430 | 0.3613 | 0.08758 |
| 3 | 84348301 | M | 11.42 | 20.38 | 77.58 | 386.1 | 0.14250 | 0.28390 | 0.2414 | 0.10520 | 0.2597 | 0.09744 | 0.4956 | 1.1560 | 3.445 | 27.23 | 0.009110 | 0.07458 | 0.05661 | 0.01867 | 0.05963 | 0.009208 | 14.91 | 26.50 | 98.87 | 567.7 | 0.2098 | 0.8663 | 0.6869 | 0.2575 | 0.6638 | 0.17300 |
| 4 | 84358402 | M | 20.29 | 14.34 | 135.10 | 1297.0 | 0.10030 | 0.13280 | 0.1980 | 0.10430 | 0.1809 | 0.05883 | 0.7572 | 0.7813 | 5.438 | 94.44 | 0.011490 | 0.02461 | 0.05688 | 0.01885 | 0.01756 | 0.005115 | 22.54 | 16.67 | 152.20 | 1575.0 | 0.1374 | 0.2050 | 0.4000 | 0.1625 | 0.2364 | 0.07678 |
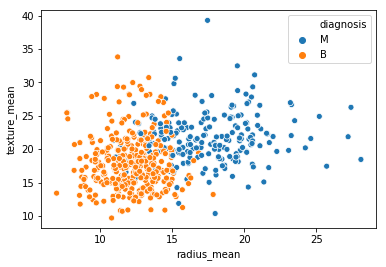
sns.scatterplot(x=”radius_mean”,y=”texture_mean”,hue=”diagnosis”,data=data)

Fig. 2. Scatter Plot – Texture Mean vs. Radius Mean
Here you can see the two ‘classes’ – ‘M’ stands for malignant and ‘B’ stands for benign. As you can see, the classes are well divided and are easily differentiable to the naked eye for these two features. However, this will not be true for all pairs of features.
Models that can be used for such a classification are:
- Logistic Regression
- Support Vector Classifiers
You can also use Decision Trees, Random Forests and other algorithms but Logistic Regression and Support Vector Classification are used exclusively for binary classification.
Stay tuned for the next installment in this series to learn about Multi-class Classification.
Visit QuantInsti for additional insight on this topic: https://blog.quantinsti.com/machine-learning-classification/
Disclaimer: All investments and trading in the stock market involve risk. Any decisions to place trades in the financial markets, including trading in stocks or other financial instruments is a personal decision that should only be made after thorough research, including a personal risk and financial assessment and the engagement of professional assistance to the extent you believe necessary. The trading strategies or related information mentioned in this article is for informational purposes only.
Disclosure: Interactive Brokers Third Party
Information posted on IBKR Campus that is provided by third-parties does NOT constitute a recommendation that you should contract for the services of that third party. Third-party participants who contribute to IBKR Campus are independent of Interactive Brokers and Interactive Brokers does not make any representations or warranties concerning the services offered, their past or future performance, or the accuracy of the information provided by the third party. Past performance is no guarantee of future results.
This material is from QuantInsti and is being posted with its permission. The views expressed in this material are solely those of the author and/or QuantInsti and Interactive Brokers is not endorsing or recommending any investment or trading discussed in the material. This material is not and should not be construed as an offer to buy or sell any security. It should not be construed as research or investment advice or a recommendation to buy, sell or hold any security or commodity. This material does not and is not intended to take into account the particular financial conditions, investment objectives or requirements of individual customers. Before acting on this material, you should consider whether it is suitable for your particular circumstances and, as necessary, seek professional advice.


Join The Conversation
For specific platform feedback and suggestions, please submit it directly to our team using these instructions.
If you have an account-specific question or concern, please reach out to Client Services.
We encourage you to look through our FAQs before posting. Your question may already be covered!