Data exploration is an important part of the modeling process. It can also take up a fair amount of time. The awesome DataExplorer package in R aims to make this process easier. To get started with DataExplorer, you’ll need to install it like below:
install.packages("DataExplorer")Let’s use DataExplorer to explore a dataset on diabetes.
# load DataExplorer
library(DataExplorer)

# read in dataset
diabetes_data <- read.csv("https://raw.githubusercontent.com/jbrownlee/Datasets/master/pima-indians-diabetes.csv", header = FALSE)

# fix column names
names(diabetes_data) <- c("number_of_times_pregnant", "plasma_glucose_conc", "diastolic_bp", "triceps_skinfold_thickness", "two_hr_serum_insulin", "bmi", "diabetes_pedigree_function", "age", "label")

# create report
create_report(diabetes_data)
Running the create_report line of code above will generate an HTML report file containing a collection of useful information about the data. This includes:
- Basic statistics, such as number of rows and columns, number of columns with missing data, count of continuous variables vs. discrete, and the total memory allocation
- Data type for each field
- Missing data percentages for each column
- Univariate distribution for each column
- QQ plots
- Correlation analysis
- PCA
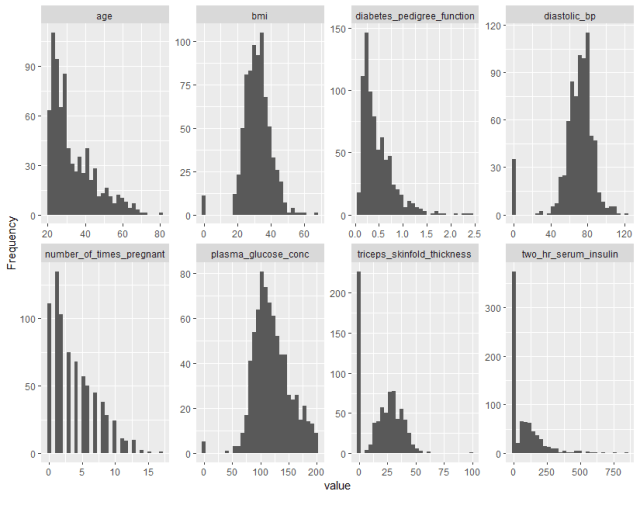
That’s right – a single line of code can generate all of the above for a given dataset! It’s also possible to get each of these pieces individually. For example, in a single line of code, we can generate histograms for all the numeric variables in the dataset.
plot_histogram(diabetes_data)
Similarly, we can get bar plots for all categorical variables in the dataset
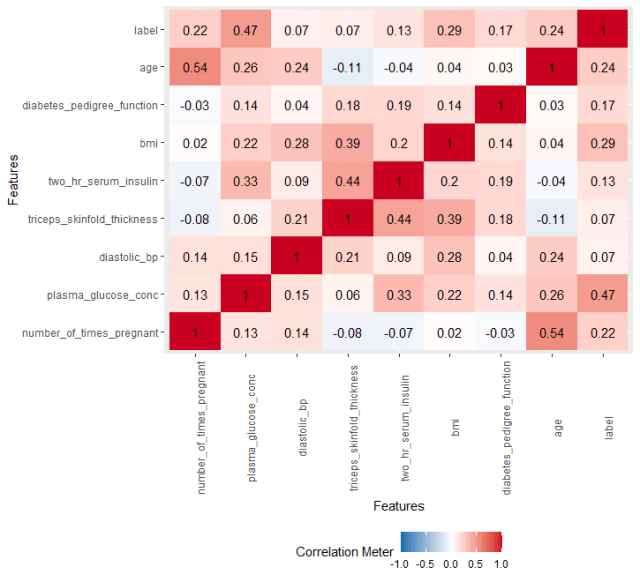
plot_bar(diabetes_data)Here’s an example getting the correlation plot:
plot_correlation(diabetes_data)
Configuring the report
It’s also possible to make adjustments to the output generated by create_report. For example, if you don’t want the QQ plots, you could set add_plot_qq = FALSE
config <- configure_report(add_plot_qq = FALSE)

create_report(config = config)
One hot encoding
DataExplorer also comes with a function to perform one hot encoding. You can one hot encode all the categorical variables in the dataset by passing the data frame name to the dummify function. In this case, we don’t have any categorical variables to encode, so the function will generate a warning.
dummify(diabetes_data)Visit TheAutomatic.net blog for additional insight on this topic and to find DataExplorer scripts and documentation.
Disclosure: Interactive Brokers Third Party
Information posted on IBKR Campus that is provided by third-parties does NOT constitute a recommendation that you should contract for the services of that third party. Third-party participants who contribute to IBKR Campus are independent of Interactive Brokers and Interactive Brokers does not make any representations or warranties concerning the services offered, their past or future performance, or the accuracy of the information provided by the third party. Past performance is no guarantee of future results.
This material is from TheAutomatic.net and is being posted with its permission. The views expressed in this material are solely those of the author and/or TheAutomatic.net and Interactive Brokers is not endorsing or recommending any investment or trading discussed in the material. This material is not and should not be construed as an offer to buy or sell any security. It should not be construed as research or investment advice or a recommendation to buy, sell or hold any security or commodity. This material does not and is not intended to take into account the particular financial conditions, investment objectives or requirements of individual customers. Before acting on this material, you should consider whether it is suitable for your particular circumstances and, as necessary, seek professional advice.


Join The Conversation
For specific platform feedback and suggestions, please submit it directly to our team using these instructions.
If you have an account-specific question or concern, please reach out to Client Services.
We encourage you to look through our FAQs before posting. Your question may already be covered!