TWS Release Notes
Optimized Order Entry for Maximum Efficiency
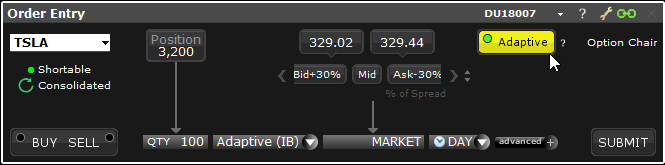
The redesigned Mosaic Order Entry panel with the Adaptive algo button, Relative Price buttons, and Relative Price Wand supports faster and more efficient order entry, and is optimized to help you more easily submit orders that split the spread. Orders submitted within the bid/ask spread attempt to fill at a better price than the current NBBO - better than the ask for a buy order and better than the bid for a sell - and because they don’t immediately fill and take liquidity like market orders, may save exchange liquidity charges and even generate rebates for adding liquidity to the market as they work.
Adaptive ButtonThe Adaptive button lets you quickly submit an Adaptive order - designed to work for price improvement within the bid/ask spread - with a single click. Quickly cap the Adaptive order with a limit price using the Relative Price buttons or Relative Price Wand to create an Adaptive Limit order. Find out more about the IB Adaptive Algo.
Price Slider with Relative Price Buttons
The current Mosaic Price Slider offers a visual method to quickly enter a limit price between the bid and ask prices with a single click. With this new release, the slider has been enhanced to provide three modes that can be accessed using the up/down buttons to the right of the slider.
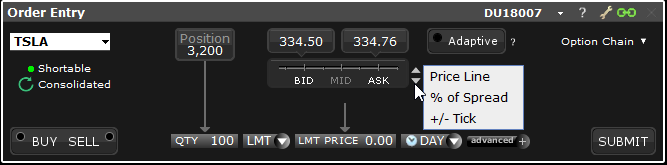
All modes offer easy price entry between the bid/ask spread:
- Price Line - The original slider with clickable BID/MID/ASK buttons
- % of Spread - Displays clickable relative price buttons that create a price based on the bid or ask plus or minus a percent of the spread, for example "Ask -30%. Available values are based on the spread at the time the tool was opened and will vary between instruments, and for the same instrument at different times if the spread changes.
- +/- Tick - Displays clickable relative price buttons based on the bid or ask plus or minus ticks, for example "Bid + 2."
The Relative Price buttons expand the functionality of the slider by providing an easy way to enter a limit price within the spread relative to the bid or ask price.
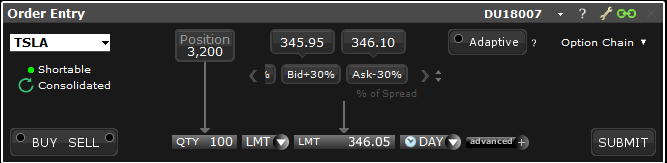
All price selections result in a one-time absolute order price that does not update regardless of market movement. When you select a relative price, (e.g. "Ask - 30%), the corresponding absolute price (346.05) is displayed in the Price field.
Relative Price WandThe Relative Price Wand adds an additional panel to the existing price wand, with functionality identical to the Relative Price Buttons but laid out vertically and displaying a larger selection of prices. The Relative Price Wand is available throughout TWS wherever you can place an order, and is invoked by clicking the price field.
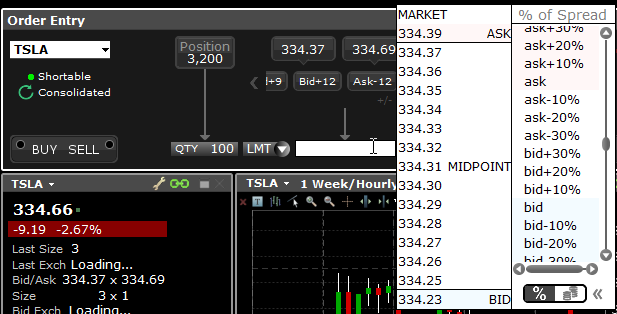
Toggle the view between percent of spread and tick increments using the icons at the bottom of the Relative Price list.
About Relative Prices
The Relative Price tools offer an alternative way to define a limit price for an order relative to the bid or ask price. Because relative price increments are calculated each time you open a relative price tool, the increments will vary between different instruments, and for the same instrument at different times. Increments are calculated using the instrument's minimum tick size and the width of the bid/ask spread at the time you open the display. Wider spreads result in more and smaller increments.
Calculating Relative Price Increments
The calculation for determining relative price increments is: Minimum tick size / spread x 100.
For example, for a US stock with a minimum tick size of 1 penny ($0.01) and spreads of 1, 2, 3, 4, and 5 ticks (0.01, 0.02, 0.03, 0.04, 0.05) the increments would be calculated like this:
1 tick: 0.01 / 0.01 x 100 = 100%
2 ticks: 0.01 / 0.02 x 100 = 50%
3 ticks: 0.01 / 0.03 x 100 = 33%
4 ticks: 0.01 / 0.04 x 100 = 25%
5 ticks: 0.01 / 0.05 x 100 = 20%
Applying Relative Prices
When you select a relative price, we calculate the absolute order price using the best bid or best ask price and the bid/ask spread at the time of the order. This means that the width of the spread used to determine price increments and the width of the spread used to calculate the absolute price could be different.
The calculation for determining the absolute price from the relative price is:
Price +/- (current width of the spread (as a percent) x relative increment (as a percent))
For example:
- If the current ask price is 346.10
- The current spread is 15 ticks
- The % increment is 30%, and
- You choose "ask - 30%" from the relative button or wand
The absolute price would be:
346.10 - (.15 x 0.30) = 346.05
IBot is Getting Smarter!
As we improve the artificial intelligence that powers IBot, our first step was to revamp IBot's user interface to make it easier to apply machine learning, based on how you interact with it. Other improvements to the interface include:
- Better presentation of information. Key elements are easier to spot in the new design which uses the full screen instead of limiting commands to text bubbles.
- You can now use keyboard shortcuts like Ctrl + 1 (Windows) or Cmd +1 (Mac) to invoke an action.
- IBot's "next step" shortcut buttons are displayed vertically and are color-coded to help identify their function quickly ("Buy" buttons are blue, "Sell" buttons are red. All others are gray).
- The open interface allows for larger text display and more space for helpful graphics like charts and tables.
- When you enter a command, it now displays in the top right corner of IBot for easy reference.
- See previous commands using the scroll bar along the right side of the interface, or use the "Up" arrow on your keyboard (Windows).
Try out this improved version of IBot from the Mosaic New Window drop down by selecting IBot (Beta) - type to trade.
Find out more about IBot.
Tick-by-Tick Historical Market Data via API
Effective with API version 973.04, you can now retrieve tick-by-tick historical data via the API using the function IBApi::EClient::reqHistoricalTicks, which corresponds to the TWS Time & Sales window.
For samples and more information, see http://interactivebrokers.github.io/tws-api/historical_time_and_sales.html.
Trading Tool Shortcuts in Mosaic Order Entry Panel
In TWS 966 we added the Adaptive Algo shortcut button to the Mosaic Order Entry panel. Now we've added a useful set of drop down shortcuts to the Option Chain button. These shortcuts open the selected tool with the current Instrument Type as the focus. Shortcuts include Option Chain, BookTrader, Market Depth, Strategy Builder, Fundamentals, Time & Sales and Alerts.
To quickly access any of the above tools from the Mosaic Order Entry Panel, click the "down" arrow on the Option Chain button and make your selection. When you select a tool, the button label changes to reflect your selection. Note that if you click the button title itself, you will open the named tool. You will only see the drop down list if you click the down arrow.
"Snap to Midpoint" Orders Available in Mosaic Order Entry Panel
We've added "Snap to Midpoint," "Snap to Market" and "Snap to Primary" orders to the Mosaic Order Entry panel. The Snap to Midpoint order is just one in our suite of advanced order types that can help you trade within the spread.
To use Snap to Midpoint and other "snap to" orders, use the LMT drop down list and select the order type.
Find out more about Snap to Midpoint orders. Other order types designed to help you trade within the spread include the Adaptive algo, Relative, Pegged-to-Midpoint, and Limit order. Visit the Order Types page to read more.
View Historical Midpoint in Implied Volatility Viewer
You can now view the historical midpoint for an expiry in the Implied Volatility Viewer. To see the historical midpoint, ensure that only one "Last Trading Day" is selected. In the "Days" section of the title use the "+" to select a historical period, for example 3 weeks. Right click in the graph and from the context menu select Historical Midpoint. You'll see the historical midpoint put and call values represented by triangles (downward-pointing for puts, upward for calls). See the associated value by holding your mouse over a triangle.
To open the Implied Volatility Viewer, from the New Window drop down select Options Analysis, then select Interactive Analytics and then Implied Volatility Viewer.