TWS Release Notes
These release notes document the major enhancements and bug fixes distributed in the current TWS version 946.
Exposure Fee Impact Available in Check Margin Box
A small minority of IB customer accounts that have a very high worst-case loss risk exposure will be subject to a Daily Exposure Fee. While most accounts will not be affected, accounts that hold unusually risky positions can now view the Exposure Fee Impact prior to submitting an order using the "Check Margin" tool. This tool is available in Classic TWS from the right-click menu on an order line, and from Mosaic using the Check Margin button on the Advanced order panel.
For more information on the Exposure Fee, see the Costs section of the IB web site.
Redesigned Options Selector
The contract selector for options, which is invoked when you add an option ticker to a page, has been drastically redesigned. Add an underlying and select "Option" to open the Option Selector. Available expiries are listed in a tabset across the top. By default the next four quarterly expirations are listed in a white font. Click on the tab titled 'more' to the right to display all available expirations, and a final selection box where weeklies and quarterly expirations are available. When selected, the next four weekly expirations will populate the tabs in yellow. Deselect the weeklies/quarterly check box from the 'more' tab to return to the regular quarterly expiration series.
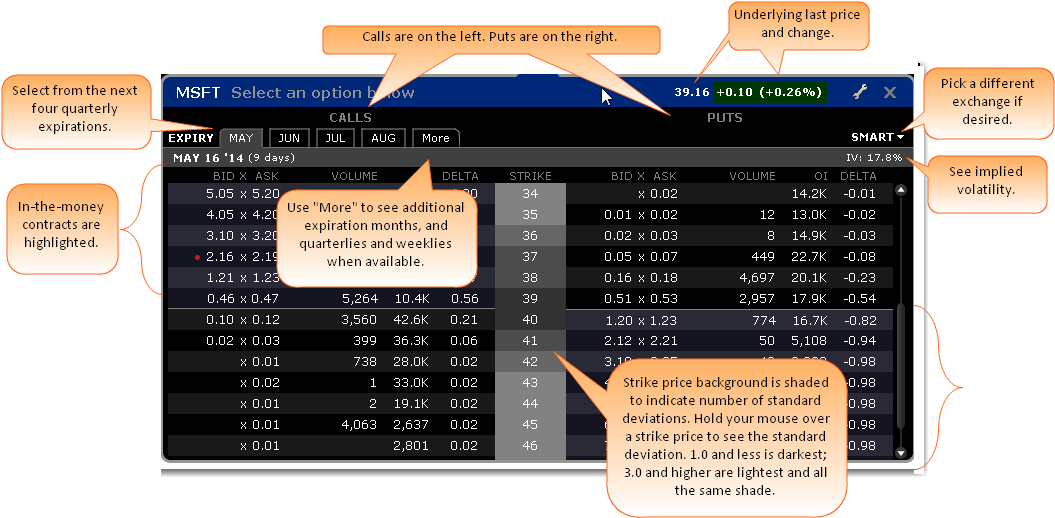
The current underlying last price and change are in the top right corner and the available, selectable options-per-expiry are listed vertically. The IV upper right. Use the 'Smart' dropdown to select a specific exchange if needed. In-the-money contracts are highlighted using a default gray scale. Lighter shades of gray relate to out-of-the-money calls and puts while darker shades reflect closer to-the-money contracts. Hovering over the strike price reveals a popup box detailing the Standard Deviation relating to the required movement from the prevailing price of the underlying to reach the strike price. (Note that Standard Deviations can also be plotted on IB interactive charts using the selection in the Chart Parameters box). Strike price color-coding can be configured to fall colors (orange and brown) by clicking on the wrench icon and changing from gray scale to fall. Configure further according to sensitivity to stock price movement. Choose between 1, 2 and 3 Standard Deviations or 1.0, 1.5, 2.0, 2.5 and 3.0 SDs. Clicking on any call or put will add it to a main TWS page. Each line added will be color-coded in either green or pink to designate in-and out-of-the-money options, respectively.
Market Statistics Scanner
The Market Statistics scanner has now been added to Mosaic as its own tab. Market Statistics are sorted by exchange and display:
- Advancing, declining and unchanged issues
- Up, down, unchanged and total volume
- TRIN and TICK indicators
To view Market Statics, from the Mosaic Monitor use the "+" sign to display the new tab selection list, and choose Market Statistics.
Performance Profile
In build 945 we introduced a new tool, Performance Profile, which was available from the Performance button in the Strategy Builder. This tool has now been included in other TWS tools, and it is now invoked from the Margin/Performance button. It can be accessed from the Order Entry window, the Order Confirmation box and from the right-click menu from an order, a ticker or a position.
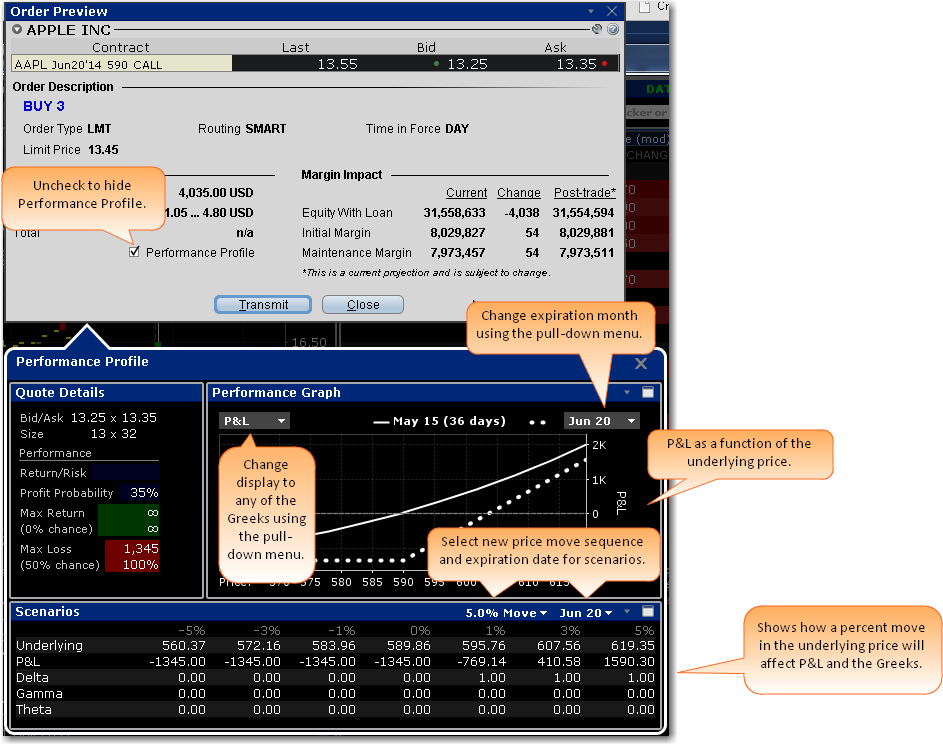
The Performance Profile helps demonstrate the key performance characteristics of an option or complex option strategy, and comprises an enhanced Quote Details window that show the Return/Risk Profit Probability and the potential Max Return and Max Loss; a Performance Graph that shows the P&L (or any of the Greeks) as a function of the underlying price; and the Scenarios window, displays the effects of a change in underlying price on the P&L, the Greeks, and the volatility of a positions.
Risk Navigator Design Enhancements
The IB Risk Navigator has been reworked to provide stand-alone risk windows that can be included in the Mosaic workspace, instead of having an independent frame that functioned as its own workspace. From the New Window drop down in Mosaic or the Analytical Tools menu in Classic TWS, the Risk Navigator selection provides a choice of stand-alone tools including the ability to open "My Portfolio" which is your actual portfolio, or to open a new or saved hypothetical "What If" portfolio. Note that the old menu system in the Risk Navigator frame has been integrated into the standalone My Portfolio window. This design makes it easier to access a hypothetical "What If" without requiring that you start up the entire Risk Navigator workspace and portfolio. Additionally, if you are working on a "What If" when you log out of TWS, all changes are saved and the "What If" window will be restored when you next log into TWS.
Option Analytics Updates
The Option Analytics window has been completely overhauled to include the same look and feel as our other option tools and provide both the Greeks (in addition to P&L) and the addition of the same dynamic curve scenarios that you have come to know and love in the Risk Navigator P&L chart, specifically:
- Most Recent
- Custom Data Scenario
- Expiry
Move your mouse over the curves to highlight the current value. Also, note that the current underlying price is highlight on the bottom axis, and the close price is marked by a light gray vertical line. To open Option Analytics, from Mosaic use the New Window drop down and select Option Analytics from the Technical Analytics section. from Classic TWS, use the Analytical Tools menu and select Option Analytics from the Technical section.
Technical Indicator Studies Added to Charts
We have added many new technical indicators to our interactive charts. Click an indicator below to read about it in the TWS Users' Guide:
- Accumulation Swing Index
- Aroon Oscillator
- Aroon Up/Down
- Detrended Price Oscillator
- Donchian Channels
- Donchian Channel Width
- Double Exponential Moving Average
- Elder-Ray
- High Low Bands
- Know Sure Thing
- Mass Index
- Moving Standard Deviation
- Negative Volume Index
- Positive Volume Index
- Triangular Moving Average
- Triple Exponential Moving Average
- Volume * PMO
To add a study to a chart, use the Studies tab on the Chart Parameters page which is accessed from the chart's Edit menu.
Fixes and Changes
The following have been fixed or modified in TWS version 946:
- For TWS version 946 and higher, when you chart a complex combination or virtual security, the high/low data is no longer calculated from the legs or displayed on the chart.