TWS 983 Release Notes
Duration Field, IBKRATS Routing Supported in A/D Algo and BasketTrader
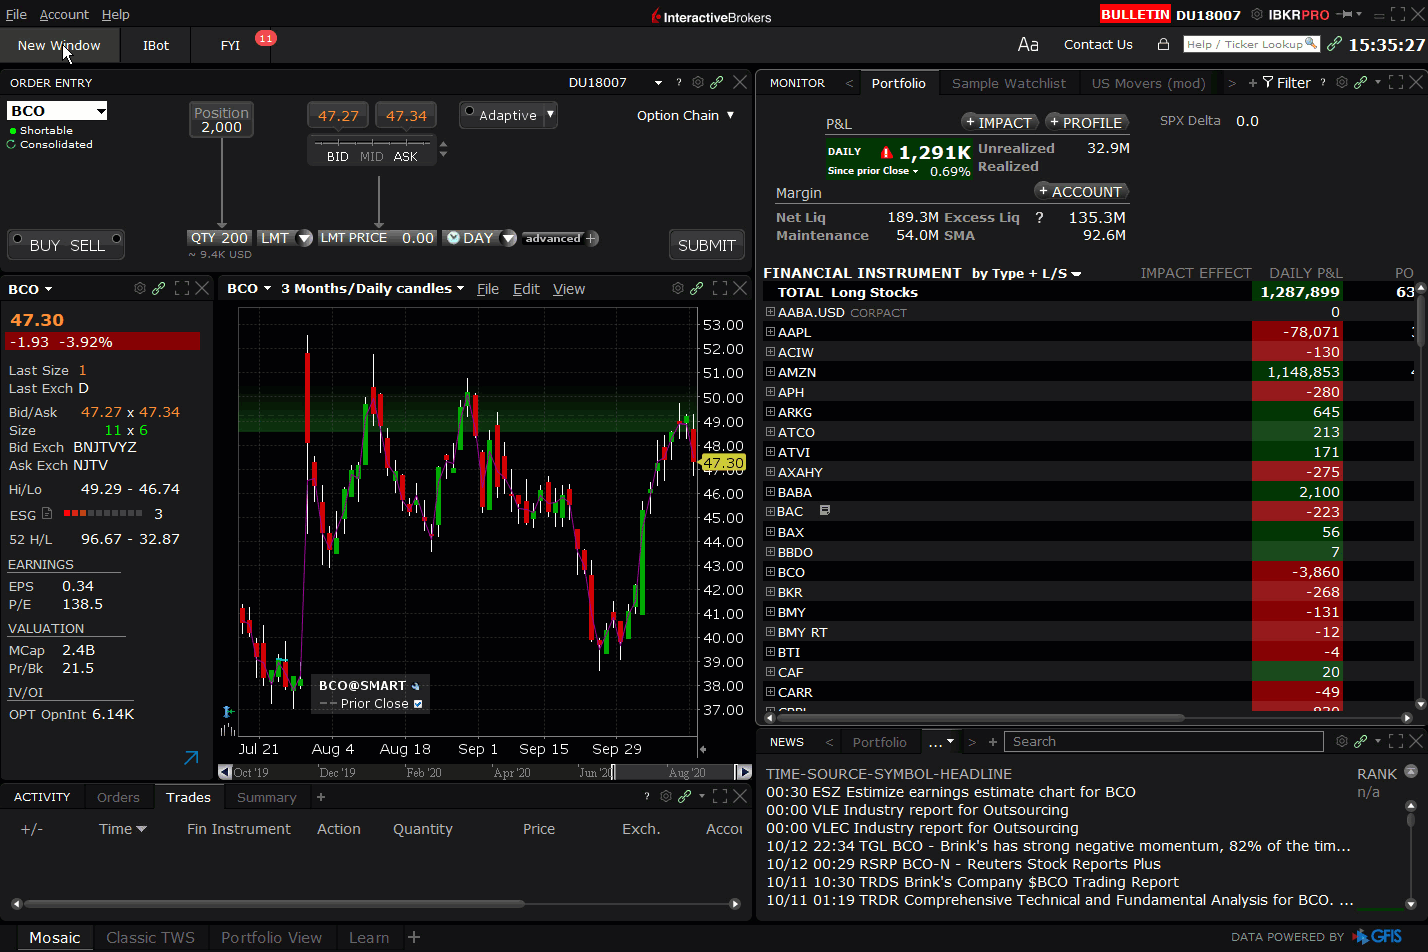
US stock orders submitted using the Accumulate/Distribute algo and BasketTrader now provide a new "Duration" field to use in conjunction with the GTD (Good-Til-Date/Time) time-in-force attribute. This TIF allows you to define the time period over which the order will work before being cancelled. Currently you need to enter the expiration date and time. The new "Duration" field will auto-calculate the expiration date/time for you. Simply enter the duration time in either seconds, minutes, or hours, and the system calculates the expiration date/time for the order.
We have also added a checkbox that allows you to "Route to IBKRATS." Check this box to have your non-marketable U.S. stock order posted to IBKR's order book for other clients to trade against it. Liquidity-adding orders directed to IBKRATS may be appropriate if you are trying to buy or sell a block of stock by trading against other IBKR customers without exposing your interest to the public markets. For more information see the IBKRATS order type page.
Streamlined Group Allocations for FAs
We have merged our two original allocation configurations, Account Groups and Allocation Profiles, into a single process under Groups. Clients who previously defined Allocation Profiles will see them listed in the Groups tab of the Advisor Setup page, identified by the same profile name and allocation method. Additionally, the allocation profile methods are still supported when creating new Groups by selecting "User-Specified" from the Create Group Method drop-down, and then using the drop-down on Contracts/Shares to choose a method.
Also, the available Group methods no longer include the Percent Change method as a selection, but this method can be used to calculate the order quantity when the Group includes positions in the selected instrument. In this circumstance, the Quantity field will show a "% Change" section where you can choose the percent by which you want to increase or decrease positions. Once calculated, the Quantity field will display the percent with either Ind or POS.
For example, if you use the Size Wand (click in the Quantity field) to select 50%:
- If the group comprises all Independent positions (none are in a Model Portfolio) and the total of all positions is 600, the Quantity display will read: 50% POS. Hold your mouse over the quantity to see the actual order size – in this case 300 shares.
- If the group includes positions totaling 600 but 200 are part of a Model, the Quantity calculation will only use the Independent positions and the Quantity display will read: 50% Ind. Hold your mouse over the quantity to see the actual order size – in this case 200 shares.
Better News and Research at your Fingertips
Our new advanced news and research "Search" tool makes it easier to find the content you really want to read:
- Open the Advanced Search from an existing newswire or from the menu. Search by topic, symbol, or keyword or any combination of these, and use conditions (and) (or) (not) for more precise results.
- Save your search for future viewing, and add your saved search as a Mosaic news tab. News items matching your search stream in real time so your saved search shows updated content throughout the day just like all of your other news feeds.
- Use our updated News Configuration section in Global Configuration to further filter your saved searches on symbols, topics & keywords, article types, news providers, and language.
- Personalized "News for You" tab provides relevant reports and headlines based on your trading patterns, recent holdings, companies in your Watchlists, and articles you read.
- Adjust "News for You" feed in News Configuration by adding or removing topics, symbols, and keywords as needed.
- "News by Topic" gives you easy access to more than 200 preset feeds you can add to your news window with just a click.
With an advanced search, improved News Reader, over 200 preset feeds, the ability to save searches that update in real-time, your own personalized news feed and more, the content you need to make better trading decisions is truly right at your fingertips.
Trade Your Way to the World You Want
Interactive Brokers is dedicated to helping you make better investment decisions. In 2018 we introduced Refinitiv Environmental, Social and Corporate Governance (ESG) metrics to provide transparency into company policy and its non-financial effects. Recently we enhanced ESG to allow you to be notified when companies engage in activities counter to your values.
Now we've expanded our responsible investing offerings even more with the interactive Impact Dashboard, which incorporates a new data source from TruValue Labs that scores companies against the Sustainability Account Standards Board (SASB) criteria.
Use the Impact Dashboard to evaluate and potentially adjust your portfolio to invest in companies whose responsible world view coincides with your own. Choose the impact values and principles that are important to you, like Racial Equality and No Animal Testing. Then let the Impact Dashboard analyze and grade your portfolio based on how your positions align with your principles. The dashboard even shows how each individual investment is helping or hurting your overall Portfolio Impact Score .By viewing companies through an "impact lens" of your own design, you can clearly see whether their socially-responsible goals and principles line up with yours.
To open the Impact Dashboard:
- In Mosaic: Use the Impact button in the Portfolio or from the New Window drop-down select Impact Dashboard.
- In Classic: Use the Impact icon in the menu bar.
To use the Impact Dashboard
Follow the prompts to set up your dashboard.
- Click to select the values that are important to you, and click a value again to tag it as "Very Important." Once you have made your selections, click Next to tag the practices you want to avoid. Read more about any value by clicking About.
Note: To make your Impact Score more meaningful, be sure to limit your selections to the values that are most important to you. They are used in the calculation of your Portfolio Impact Score, and the more values you select, the less impact each value has on your score.
- Click to select all of the Environmental, Social and Governance (ESG) practices to which you're opposed.
Note: These practices are not used in the Portfolio Impact Score calculation. Instead, we will "red flag" companies that engage in these practices so that you can avoid them if you want.
Understanding your Score
Once your selections are made we'll use this information along with the available impact data to analyze your portfolio and provide you with your Portfolio Impact Score.
- Your Portfolio Impact Score is presented in the center of the chart. Directly under the chart we tell what percentage of your portfolio provides impact data to help make the grade more meaningful.
- Hold your mouse over a slice of the chart to see the weight each slice holds within the Aligns with, Conflicts with and Neutral segments.
- To the right of the doughnut chart see the values and practices you selected as being important:
- Values show a letter grade in the top right corner. This grade identifies how well or how poorly your portfolio performs in this specific area. Select a graded value to see more details that show how your investments contribute to the value grade.
- Flagged practices show a red number in the upper right corner. This indicates how many companies in your portfolio engage in specific practice. Select a flagged practice to see which companies in your portfolio engage in that practice.
- Below the chart see the list of all of your positions with the Impact Effect, Industry, Analyst Rating and more. Click an instrument to see how going long or selling short would affect your Portfolio Impact Score.
- For those position that either conflict with or are neutral toward your values, click to see a list of comparable, alternative instruments that are more in line with your principles. Elect to trade out of the conflicting/neutral asset and create a position in an alternative instrument.
Edit your preferences at any time by clicking the pencil icon next to the Your Preferences title.
Separate the Signal from the Static with Social Sentiment Data
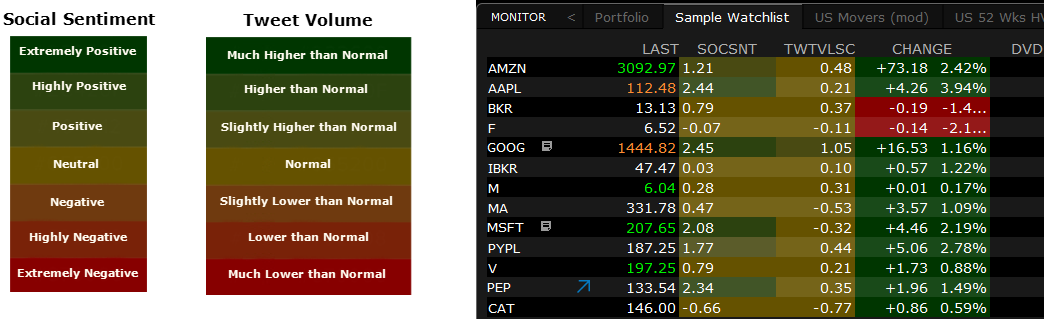
Now you can see current and trending market sentiment scores for companies in your Watchlist, Portfolio and throughout TWS with social sentiment data from Social Market Analytics Inc. (SMA). Data is derived from the content and volume of unique Tweets, which have been triple-filtered for relevance and credibility from the daily Twitter stream of over 500 million Tweets. Social Sentiment scanners coming soon.
Current data coverage includes the entire US equity universe, over 3000 global ETFs and the LSE FTSE 1000, with content updating every 1 minute. FX and Commodity futures and FX Spot coverage coming soon.
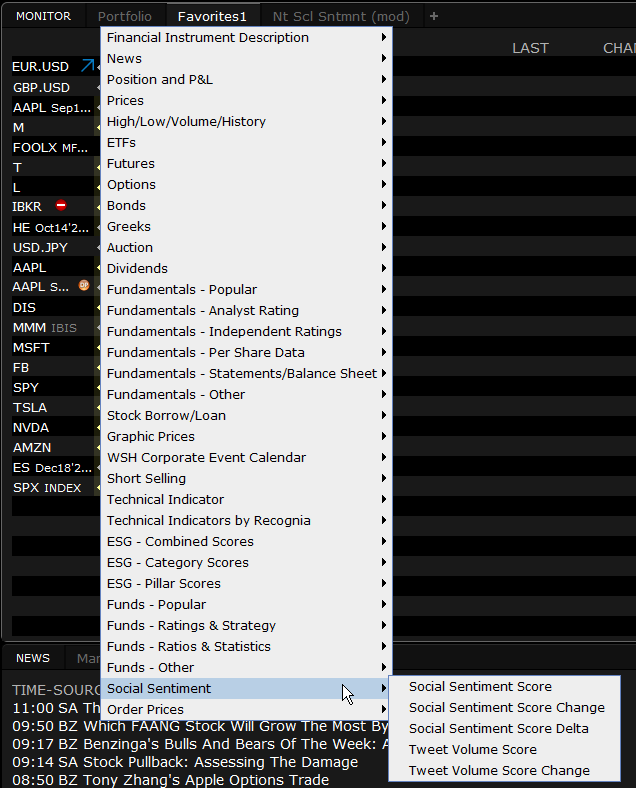
We provide the following data points that you can view in the Social Sentiment widget in the Fundamentals Explorer and in the Social Sentiment columns that you can display in your Watchlists, Scanners, Portfolio and other tools:
- Social Sentiment Score: The normalized, time-weighted summation of sentiment of Tweets from credible accounts across a 24-hour rolling window, at the time of observation. Tweets arriving closer to the observation time carry more weight than those that arrived farther from the observation window. For example, at 09:10 AM, it is the summation of sentiment of tweets received between 09:10 AM the previous day and 09:10 AM today weighted such that the tweets closer to 9:10 AM today are weighted higher.
- Social Sentiment Score Change: From the prior day's average.
- Social Sentiment Score Change: From the prior day's average.
- Tweet Volume Score: Normalized value of Indicative Tweet volume used to compute the social sentiment score, which is the number of unique tweets arriving in a 24-hour interval from certified Social Market Analytics accounts.
- Tweet Volume Score Change: From the prior day's average.
- Tweet Volume Score Change: From the prior day's average.
- Social Sentiment Score Delta (15-Minute Sentiment Change): Change in Social Sentiment Score over a 15 minute look-back period.
- Tweet Source Diversity: Measure of the Tweet source diversity contributing to a sentiment estimate. At the time of observation, this value is calculated as: Number of unique accounts / Tweet Volume Score.
- Social Sentiment Trend chart: See how sentiment is trending over different time periods (1 day, 1 week, 1 month, 6 months and 1 year) with Tweet Volume sub-graph in the bottom panel of the chart.
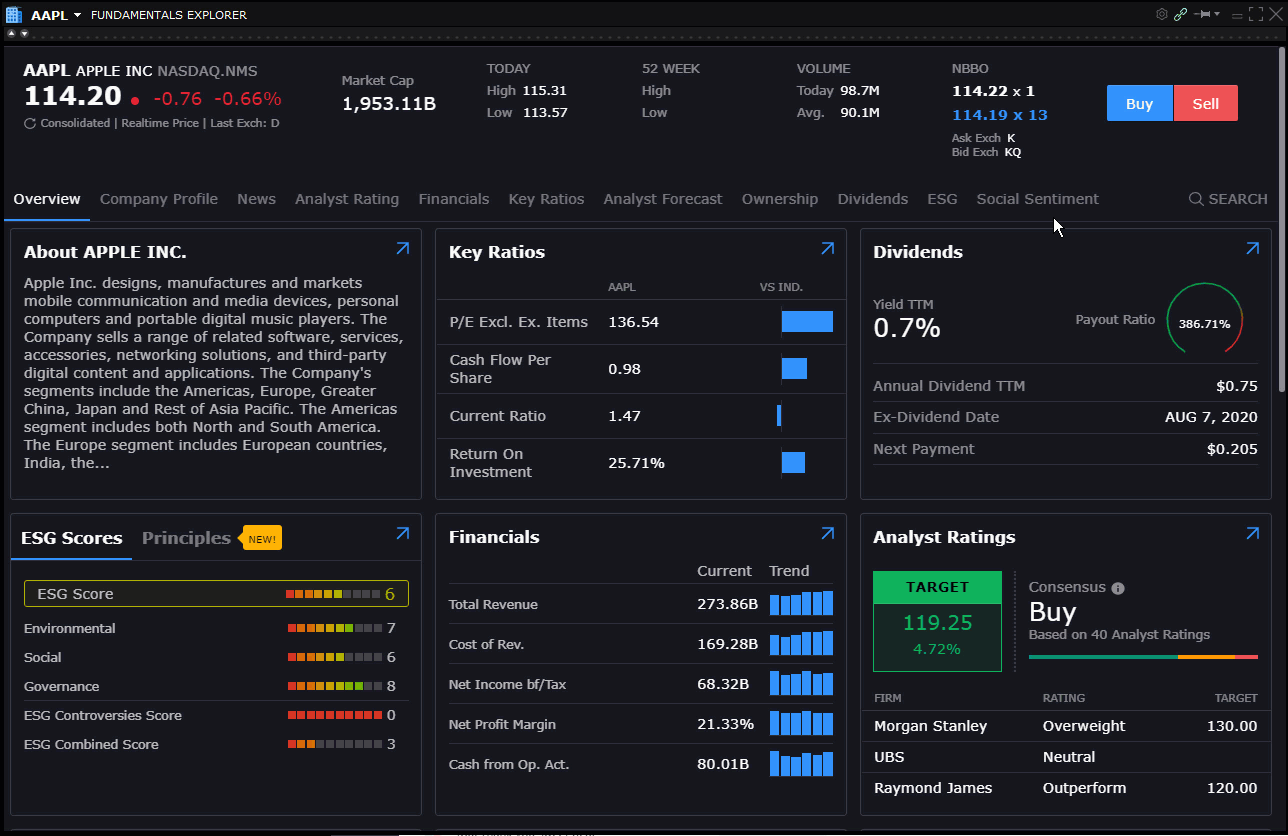
Social Sentiment Widget in Fundamentals Explorer
Open Fundamentals Explorer from the Mosaic New Window drop-down. In the Fundamentals Explorer, click the Social Sentiment tab to see a graphical representation of data points listed above.
Social Sentiment Columns
Add Social Sentiment columns to your Watchlist and other tools to see the current market sentiment for specific companies. Score and volume values range from -4.25 to 4.25. A score of 3 or higher indicates extremely positive sentiment/high volume. A score -3 or lower indicates extremely negative sentiment/low volume. Column values are color-coded for at-a-glance assessment:
To add columns to a window, hold your mouse over an existing column name until the Insert Column command appears. Click Insert Column and scroll to the Social Sentiment column group. Click a title to add the column to your window. Hold your mouse over a title in the group to see the column definition.
Fixes and Enhancements
- Removed 'Pop Up' Order Ticket for Missing Prices: Previously when an order was missing the most current price or other attribute, the Order Ticket dialog box would pop up on top of the Order Entry Panel, the Order Line or even the Rebalance Window for you to complete the order. In cases where you might be creating multiple orders (Rebalance) this feature could be particularly intrusive. We have now changed the default action to suppress the Order Ticket in these cases. If you prefer to have the Order Ticket pop up, you can turn this feature on within Global Configuration by checking "Show Order Ticket dialog when unable to create order due to missing attributes" in the Orders > Settings configuration page.Regardless of the default setting, you can still use the Order Ticket at any time via the right-click Modify menu or from the Classic toolbar.