TWS Release Notes
Limit Price Shows Debit/Credit in Order Entry for Complex Strategies
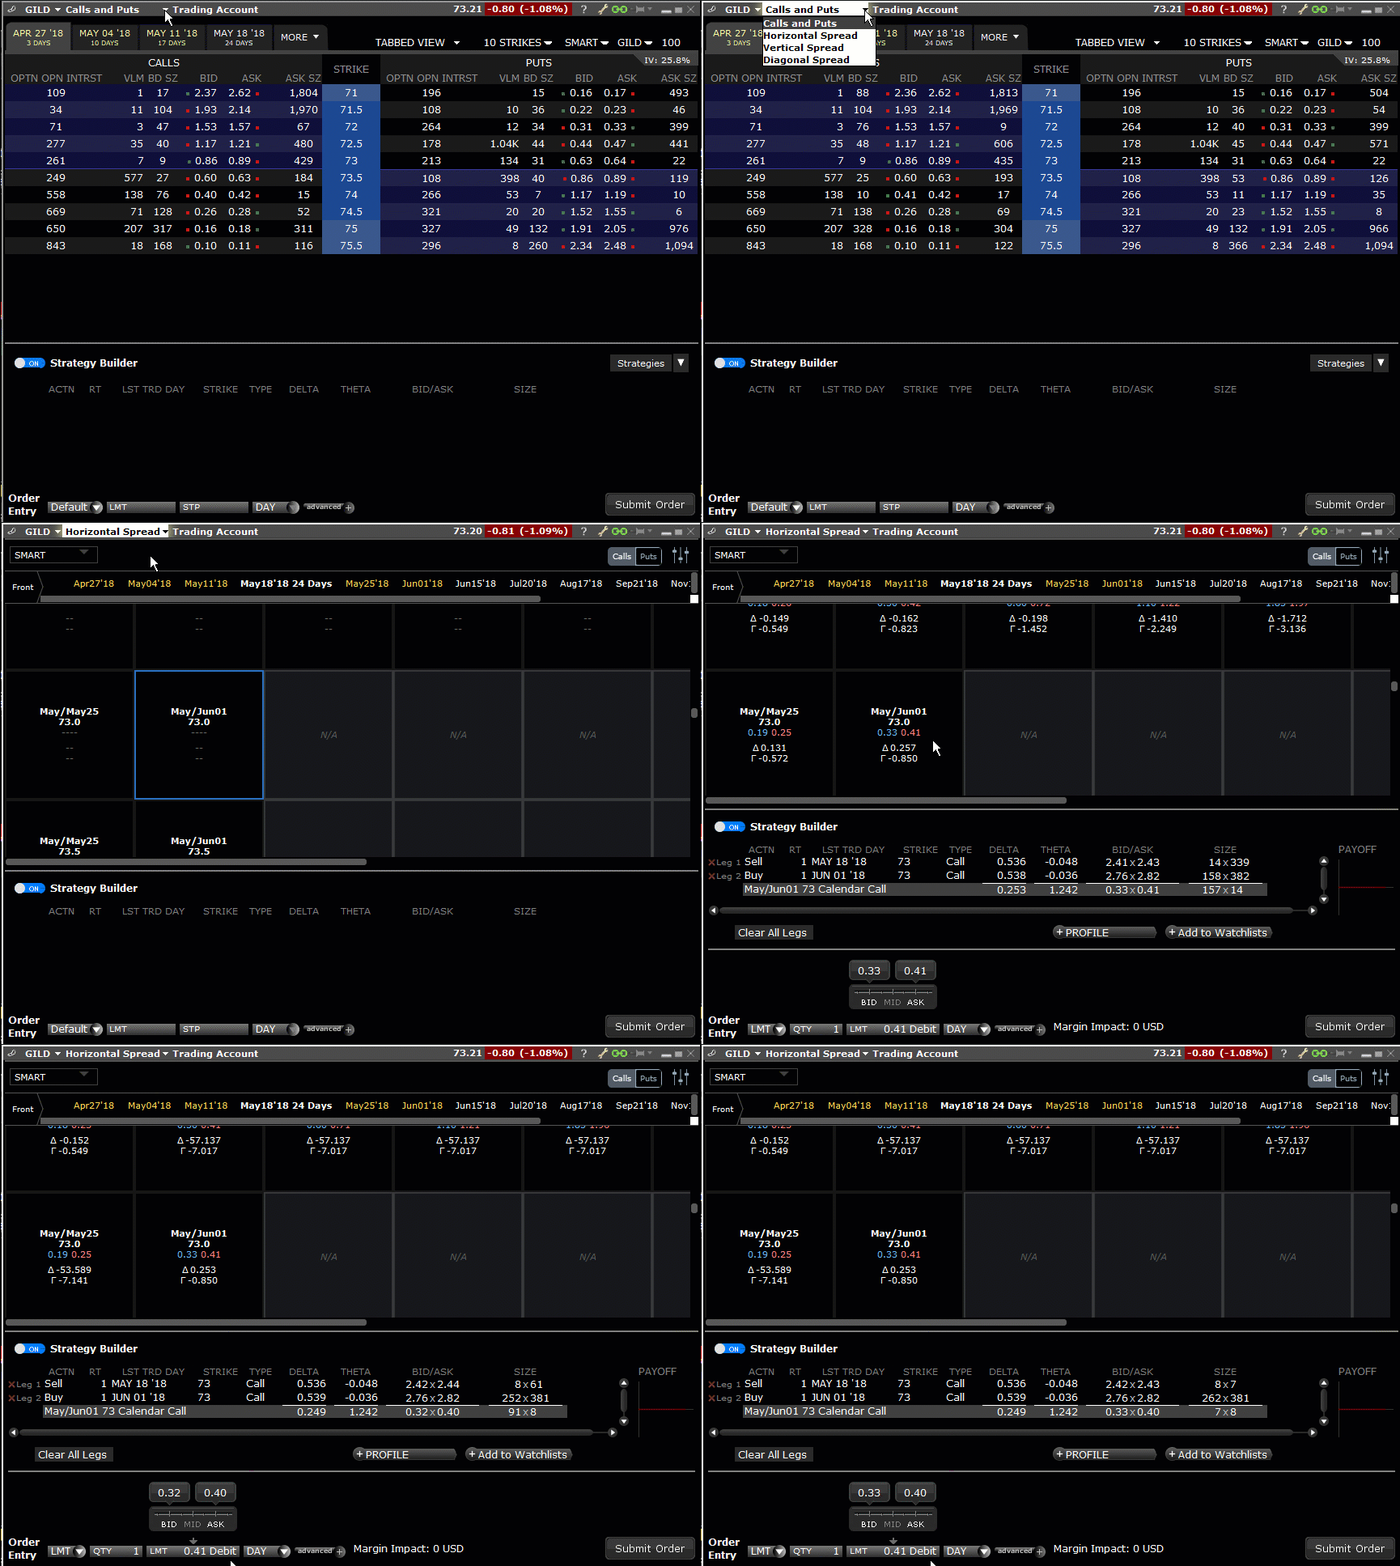
Understand at a glance the impact that trading a complex strategy will have on your account with the new "Debit" and "Credit" designations included in the Limit Price field of the Order Entry panel. See this change in Mosaic, in the Strategy Builder, and anywhere the Order Entry panel is used to submit complex multi-leg orders.
Option Spread Templates
We now offer a simple-to-use grid interface with spread templates for comparing and creating option spreads, accessible from the Option Chain page. This grid interface allows you to easily compare prices, spread tightness, Delta, and Gamma across a range of similar strategies and quickly populate the Strategy Builder with the one you want.

To use the Spread Templates, from the Option Chain page use the drop-down in the blade (to the right of the symbol) to choose a strategy (Horizontal, Vertical or Diagonal spread). The grid layout appears with the view centered near the current strike price. You can toggle the first leg between calls and puts using the Calls | Puts selector in the upper right corner. Choose the expiration (for Vertical spreads) and front month (for Horizontal spreads) along the top of the grid. For Diagonal spreads, use the Front/Back drop-down arrow to select a front and back month.
Once the spread parameters are defined, use the bottom and side scroll bars to scan and compare. Click a box within the grid to populate the Strategy Builder. As you create the multi-leg complex strategy, the Order Entry panel below the Strategy Builder populates with the strategy's bid and ask prices. Additionally, it now also identifies the limit price as "Debit" or "Credit" in the Limit Price field.
Choose "Greeks" Type for Display in Performance Profile
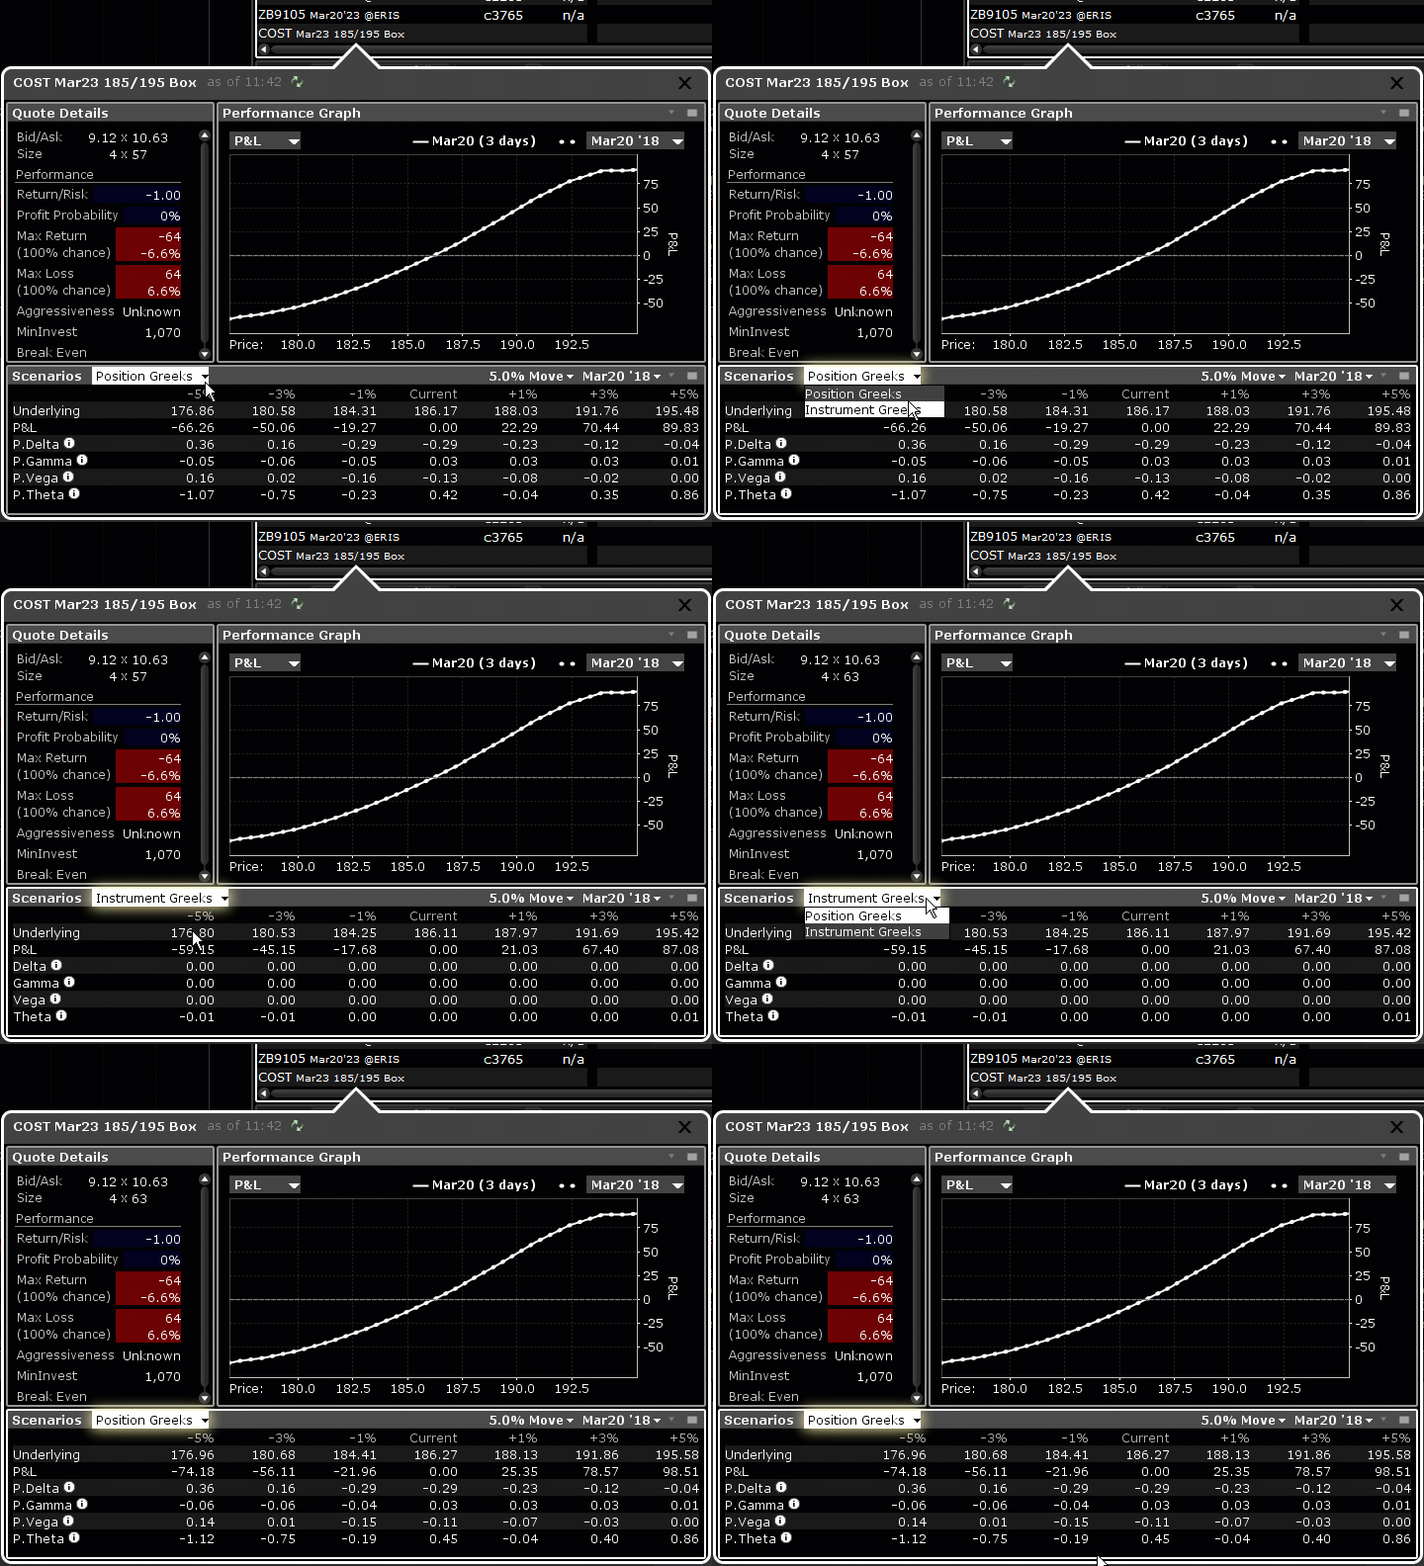
A new selector in the Scenarios blade of the Performance Profile window lets you choose between displaying the "Instrument Greeks" that show the traditional contract Greeks, and the "Position Greeks" calculated using ( Greek value x position). "Position Greeks" are identified in the Scenarios panel with a "P" prefix, for example P.Delta etc. For strategies that use different underlyings, "Instrument Greeks" are not available and the selector is disabled.

To use the Performance Portfolio analysis tool, click the "Profile" button below a strategy in the Strategy Builder. From your Watchlist or Portfolio, right-click a strategy and from the menu select Analytical Tools and then Performance Profile.
For more information on the Performance Profile tool, see the TWS Users' Guide.
Risk Navigator: Exposure Fee Report
You can now view a report for Exposure Fee on demand from within the Risk Navigator. Add the "Exposure Fee" tab by selecting "Exposure Fee" from the Risk Navigator Report menu. This tab shows a projection/estimation of any exposure fees, based on the current positions in the portfolio (both actual and what-if).
To find out more about Exposure Fees, see the Exposure Fee for High Risk Margin Accounts section of the Margin Trading page.
View Dividend and Interest Rate
We have added new standalone windows to view the Dividend Schedule and Interest Rate Term Structure. Previously these tools were only available via the Model Navigator, where they are still available, and are also editable, allowing you to enter your own values. To view the Dividend Schedule for a selected asset, use the New Window drop-down and select Option Analysis, then Interactive Analytics then Dividend Schedule. To view the Interest Rate structure, use the New Window drop-down and select Option Analysis, then Interactive Analytics then Interest Rate. Alternatively, you can select both tools from the right-click menu within the Implied Volatility Viewer.
3D Vol Surface Volatility Units
The 3D Volatility Surface webtool now allows you to specify the volatility unit. By default the unit is set to daily, but you can change it to "annual" using the Volatility Unit radio buttons under the "Displayed Last Trading Dates." To open the 3D Volatility Surface webtool, click the "3D" button in the Implied Volatility Viewer. Alternatively, use the New Window drop-down and select Option Analysis, then Interactive Analytics, then 3D Volatility Surface. Then, select the symbol for which you want to view the 3D vol surface.
Outside RTH Options Greeks
We now calculate the SPX Greeks for live options trading outside regular trading hours, when the option's underlying is closed. Values are based on the theoretical underlying price that is implied based on the lead futures. This is reflected throughout TWS and in the IB Risk Navigator.
Accumulate/Distribute Order Side
The Accumulate/Distribute Algo window has been modified to require a user to specify the order side (BUY or SELL) instead of offering a default order side.
To find out more about the Accumulate/Distribute algo, see the TWS Users' Guide
Fixes
- When changing a hedging contract for an Attached Delta Hedge order, the order side would flip and make the order invalid. This has been fixed.
- We have made the Performance Portfolio sidecar attached to the Strategy Builder more useful by enlarging the Quote Details tile to display all data without needing to scroll, and by defaulting to today's data so that important data, specifically today's total delta and theta, are visible when the sidecar opens.
- The "Average Price" calculation in partitioned portfolios was incorrect. This has been fixed.