TWS Version 948 - Release Notes
Trade Bonds in Mosaic Order Entry Panel
The Mosaic Order Entry panel now supports trading bonds. The context-sensitive content is modified for bond orders. The Last and Yield fields are displayed, and the Quantity value displays in bond sizes. Click the Bid, Ask or Last price to update the price field. Note also that the Order Types list includes only order types available for bonds, and the Advanced panel includes only those items applicable to bond orders.
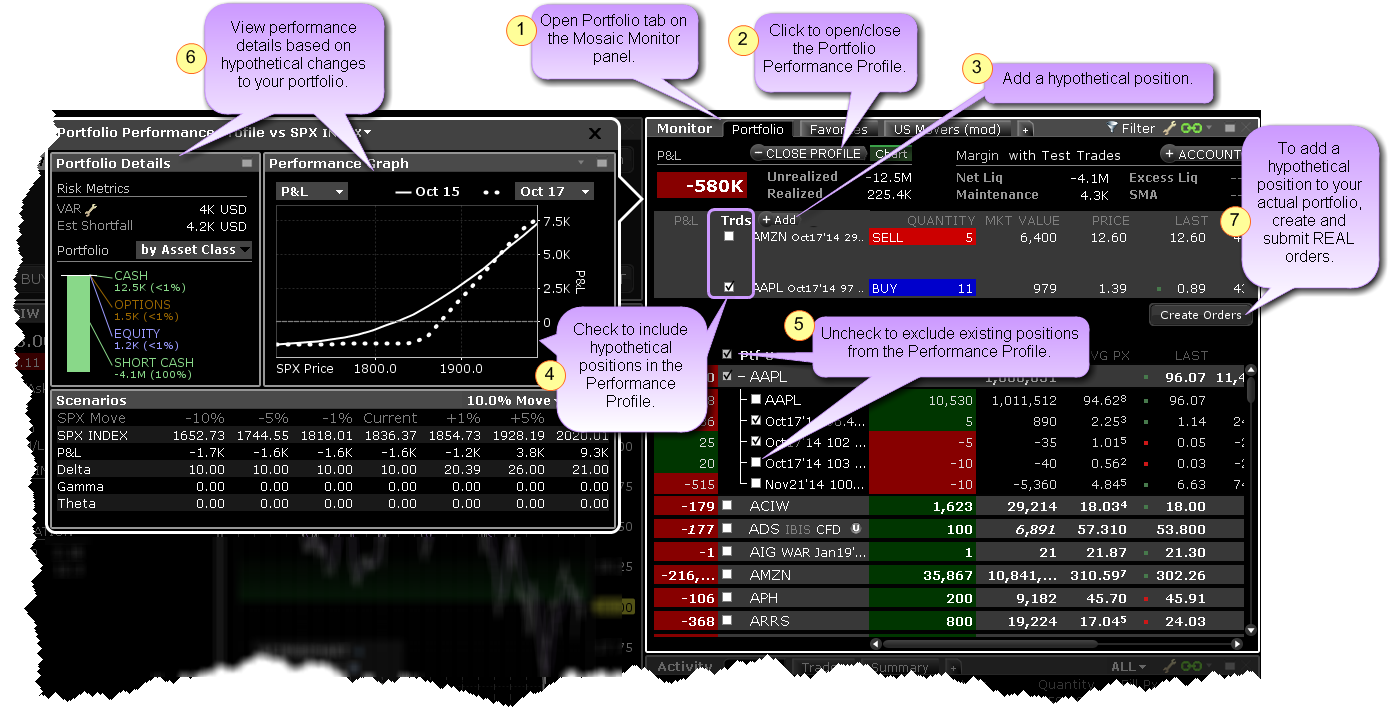
Portfolio Performance Profile
This new what-if feature allows you to toggle the Mosaic Portfolio window into "what-if" mode and add or remove hypothetical positions to and from your existing portfolio to see how these changes will affect key portfolio metrics, including P&L, Delta and the Greeks and Value at Risk. If you like the performance results from the hypothetical adding or removing of any positions, you can create and submit real orders to add these positions to your actual portfolio.
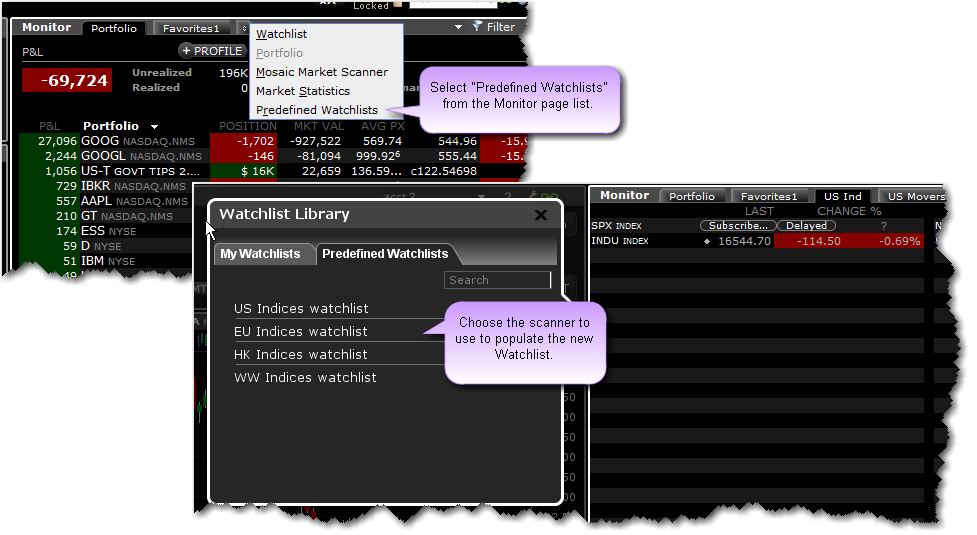
Scanner-based Predefined Watchlists
A new page in the Mosaic Monitor panel, Predefined Watchlists, allows you to create a new Watchlist page that is pre-populated using contracts from a user-selected scanner. The list of tickers is automatically refreshed each time you log in. The predefined Watchlist for US Treasuries includes the Mark Yield field.
OptionTrader: Multiple Tabs for Same Underlying
When you elect to add a tab to the OptionTrader (Option Chains>Add Tab) to view multiple assets in the same window, previously you were required to use a different underlying, otherwise the system would simply toggle to the already-created tab. With 948, you can now add multiple tabs for the same ticker. The system will ask whether you want to switch to the existing ticker or create a new tab for the ticker.
Configure "Close Portion of Positions" Hotkey
Users can now configure the Close Portion of Positions hotkey to:
- Ask for a percentage (same as current functionality and allowing greatest flexibility)
- Close as close to 100% of the position as possible
- Close as close to 75% of the position as possible
- Close as close to 50% of the position as possible or
- Close as close to 25% of the position. as possible
To configure the hotkey, open Global Configuration from the Mosaic File menu (or Classic TWS Edit menu) and click Hotkeys in the left panel. In the Possible Actions section, double-click Close Portion of Positions. In the Customize section at the bottom of the Configure Hotkey box select the action that will be invoked for the specific hotkey.
Previously using this hotkey always invoked a dialog box asking the user to enter the percent of the position they would like to close.
SimplerOptions© Chart Indicators
We are pleased to offer a new set of chart indicators, some free, some subscription-based, from SimplerOptions. You can try all of the indicators free for one month when you subscribe. Add indicators and studies using the chart's Edit>Studies menu command, and look under the SimplerOptions section. When you select a subscription-based indicator, a message will offer to bring you directly to the Research subscription page in Account Management.
New indicators include:
- Probability Zones (free) - The Probability Zones indicator displays 1 Standard Deviation and 2 Standard deviation lines on your chart, giving you a visual representation of the underlying formula.
- Rolling Weekly Pivots (free) - The Rolling Weekly Pivots display support and resistance levels which are dynamic and change each day based on a trailing last 5 daily bar calculation.
- A/B/C Waves - The idea behind the waves is to visualize the overall strength and direction of a given market across multiple time frames.
- Combo Wave - The Combo Wave is a condensed version of the traditional ABC Waves.
- Porsche Dots - The Porsche Dots offer a new and different way of looking at ABC waves. Instead of having the waves take up the subspace on your chart, you can now apply them directly to the price action itself. It's recommended that you choose from either the ABC Waves or the Porsche Dots.
New IB Chart Indicators
Many new indicators have been added to our interactive charts. The most recent additions are at the top of the list.
- Volume Weighted Moving Average - We now support the Volume Weighted Moving Average indicator with configurable standard deviation bands. VWAPs are not cumulative, so if you are looking at a bar chart with daily bars, each bar represents only that one day's volume-weighted average price. The standard deviation is configurable by period and multiplier.
- Least Squares Moving Average - Sometimes also called an End Point Moving Average, this indicator is based on a linear regression, but goes one step further by estimating what would happen if the regression line continued. Least Squares Moving Average is used mainly as a crossover signal with another moving average or with itself.
- Linear Regression Curve - Plots a line that best fits the prices specified over a user-defined time period. The Linear Regression Curve is used mainly to identify trend direction and is sometimes used to generate buy and sell signals.
- Linear Regression Intercept - A statistical tool used to help predict future values from past values. It is commonly used as a quantitative way to determine the underlying trend and when prices are overextended.
- Linear Regression R-Squared - An indicator used to determine the strength of the dominant market trend. It is typically used with other indicators such as Linear Regression Slope. The Slope indicates the overall market trend (positive or negative) and the R-Squared indicates the strength.
- Linear Regression Slope - a common statistical technique used to identify the strength and the direction of a dominant market trend. The Linear Regression Slope is a centred oscillator type of indicator that is similar to momentum indicators. As indicated by the name of the type of indicator, it "oscillates" or fluctuates above and below a central line drawn at 0. In general, the momentum is positive when the Slope is above 0 and negative when it is below 0. It can be used to measure the strength or weakness and direction of the momentum.
- Chaikin Oscillator - The Chaikin Oscillator is a momentum indicator for the Accumulation/Distribution Line. It "turbo charges" the Accumulation Distribution Line by measuring momentum. Signals are generally more frequent and easier to quantify using the Chaikin Oscillator.
- Ichimoku Cloud - The Ichimoku Cloud indicator shows support and resistance, and momentum and trend directions. The "cloud" comprises five lines, and is formed between the spans of the conversion and base line moving averages and the midpoint of the 52-week high and low.
- Price by Volume (PVT) - Price By Volume, a variation of On Balance Volume, is a horizontal histogram that overlays the chart and helps determines the strength of trends and warn of reversals.
- Price Oscillator - Shows the difference between two moving averages, in points. Unlike MACD which always uses the 12- and 26-day moving averages, Price Oscillator can use any two user-specified values.
- Percentage Price Oscillator - A momentum oscillator for price. Shows the difference between two moving averages as a percentage of the larger moving average.
- Volume Oscillator - Measures volume by measuring the relationship between two moving averages.
- Percentage Volume Oscillator - A momentum oscillator for volume. It measures the difference between two volume-based moving averages as a percentage of the larger moving average.
- Chaikin Volatility Indicator - Shows the difference between two moving averages of a volume-weighted accumulation-distribution line. Comparing the spread between a security's high and low price quantifies volatility as a widening of the range between the high and the low price. An increase in the Volatility Indicator over a relatively short time period may indicate that a bottom is near. A decrease in volatility over a longer time period may indicate an approaching top. It is recommended to use the Chaikin Volatility in conjunction with a moving average system or price envelope.
- Historical Volatility Ratio - The HVR is the percentage of short to long average historical volatility. When a market's short volatility declines below a certain percentage of its long volatility, it may be an indication that an explosive move is imminent.
- Relative Volatility Index - The RVI is similar to the Relative Strength Index (RSI) index. Both measure the direction of volatility, but RVI uses the standard deviation of price changes in its calculations, while RSI uses the absolute price changes. The RVI is best used as a confirmation indicator to other momentum and/or trend-following indicators.
To add indicators and studies, use the chart's Edit menu and select Studies.
Fixes and Changes
The following have been fixed or modified in TWS version 948:
- The Order Wizard has been removed.
- Previously if you queried open orders via the API, a partial list might be returned if the CCP connection was not active. This has been fixed to ensure all orders are downloaded before the END marker is sent.