Interactive Brokers Home

Trade Your Predictions on Political, Economic, and Climate Events
IBKR ForecastTrader1 lets you use exchange-listed Forecast Contracts to trade your opinion on yes-or-no questions on political,2 economic and climate events. Plus you’ll earn 3.83% APY3 on your investment with an interest-like incentive coupon, and new accounts get USD 3.00 to trade Forecast contracts.
The displayed future outcome probabilities and prices are hypothetical and only intended as an example. They do not reflect current market sentiment, expected outcomes, or the opinions of IBKR.

Power Meets Simplicity
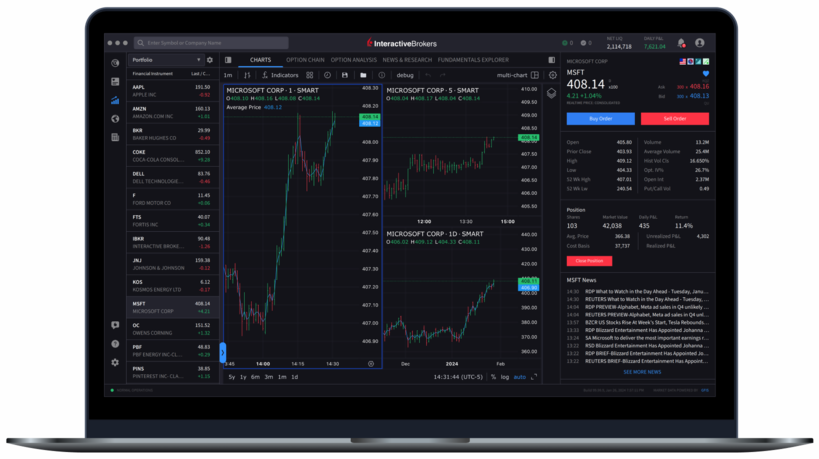
Experience the future of trading with IBKR Desktop.
Built from the ground up, it combines proven features with innovative tools in a streamlined, intuitive interface.

PortfolioAnalyst is Free!
- Financial Account Aggregation
- Advanced Investment Analysis
- Retirement Planner
- GIPS Compliant
Trade US Stocks and ETFs, Index Futures and Options, and Bonds Around the Clock
React immediately to market-moving news and trade over 10,000 US Stocks and ETFs, US Equity Index futures and options, US Treasuries, global corporate bonds, European government bonds and UK gilts when it’s convenient for you.


Award Winning Platform & Services

#1 Professional Trading
#1 International Trading

Best Online Broker,
for Advanced Traders

#1 Best Online Broker
5 out of 5 stars

Best for
Advanced Traders


Best Online Broker

Experience Professional Pricing
- Low commissions starting at $02 with no added spreads, ticket charges, platform fees, or account minimums.
- IBKR BestXTM is a powerful suite of advanced trading technologies designed to help clients achieve best execution and maximize price improvement while minimizing market impact.
- Margin rates up to 53% lower than the industry.4
- Earn high interest rates of up to USD 3.83% on instantly available cash.5
- Earn extra income on your lendable shares
Discover a World of Opportunities
Invest globally in stocks, options, futures, currencies, bonds and funds from a single unified platform. Fund your account in multiple currencies and trade assets denominated in multiple currencies. Access market data 24 hours a day and six days a week.
160
Markets
36
Countries
28
Currencies*
Global Markets
*Available currencies vary by Interactive Brokers affiliate.
Graphic is for illustrative purposes only and should not be relied upon for investment decisions.

Powerful Trading Platforms
To Help You Succeed
Award winning platforms for every investor from beginner to advanced on mobile, web and desktop.
Discover new investment opportunities with over 200 free and premium research and news providers.
Spot market opportunities, analyze results, manage your account and make better decisions with our free trading tools.
90+ order types – from limit orders to complex algorithmic trading – help you execute any trading strategy.
Real-time trade confirmations, margin specifics, transaction cost evaluation, advanced portfolio assessment and beyond.
A Broker You Can Trust
When placing your money with a broker, you need to make sure your broker is secure and can endure through good and bad times in the broader financial markets. Our strong capital position, conservative balance sheet and automated risk controls are designed to protect IBKR from major market events that can threaten the stability of financial institutions.
IBKR
Nasdaq Listed
$17.5B
Equity Capital*
74.2%
Privately Held*
$12.4B
Excess Regulatory Capital*
3.34M
Client Accounts*
3.52M
Daily Avg Revenue Trades*
IBKR Protection

*Interactive Brokers Group and its affiliates. For additional information view our Investors Relations - Earnings Release section.
Choose the Best Account Type for You
 Individual Accounts
 Joint or Trust Accounts
 Retirement Accounts
 Non-Professional Advisor
 Institutional Accounts
Step 1
Complete the Application
It only takes a few minutes
Step 2
Fund Your Account
Connect your bank or
transfer an account
Step 3
Get Started Trading
Take your investing to
the next level
FINRA BrokerCheck reports for Interactive Brokers and its investment professionals are available at www.finra.org/brokercheck
- Interactive Brokers LLC is a CFTC-registered Futures Commission Merchant and a clearing member and affiliate of ForecastEx LLC (“ForecastEx”). ForecastEx is a CFTC-registered Designated Contract Market and Derivatives Clearing Organization. Interactive Brokers LLC provides access to ForecastEx forecast contracts for eligible customers. Interactive Brokers LLC does not make recommendations with respect to any products available on its platform, including those offered by ForecastEx.
- Forecast Contracts on US election results are only available to eligible US residents.
- Payments equivalent to interest in the form of an incentive coupon subject to variation with benchmark rates.
- IBKR Lite provides commission-free trades in US exchange-listed stocks and ETFs. For complete information, see ibkr.com/commissions.
- Interactive Brokers Group and its affiliates. For additional information view our Investors Relations - Earnings Release section.
- Interactive Brokers LLC rating by Standard & Poor's. View report
- For complete information, see ibkr.com/compare.
- Restrictions apply. See additional information on interest rates. Credit interest rate as of April 2, 2025.
- Available currencies vary by Interactive Brokers affiliate.